create a list of plots cleanly with extra pdf functionality
print_plots(
  .ggplot_list,
  .start_page_number = NULL,
  .start_break = TRUE,
  .end_break = TRUE
)
Arguments
| .ggplot_list | list of ggplot plots |
|---|---|
| .start_page_number | pdf-only starting page number for plots |
| .start_break | whether to add a page break before starting to print plots |
| .end_break | whether to add a page break after the plot output |
Details
Especially for pdf, this can allow the generation of clean pdf pages with only plots, no code, warnings, etc. for all pages related to the plots. In addition, by controlling the start number, you can further trim the pdf to slice out the extra pages generated from the output but keep a nicely numbered plot appendix
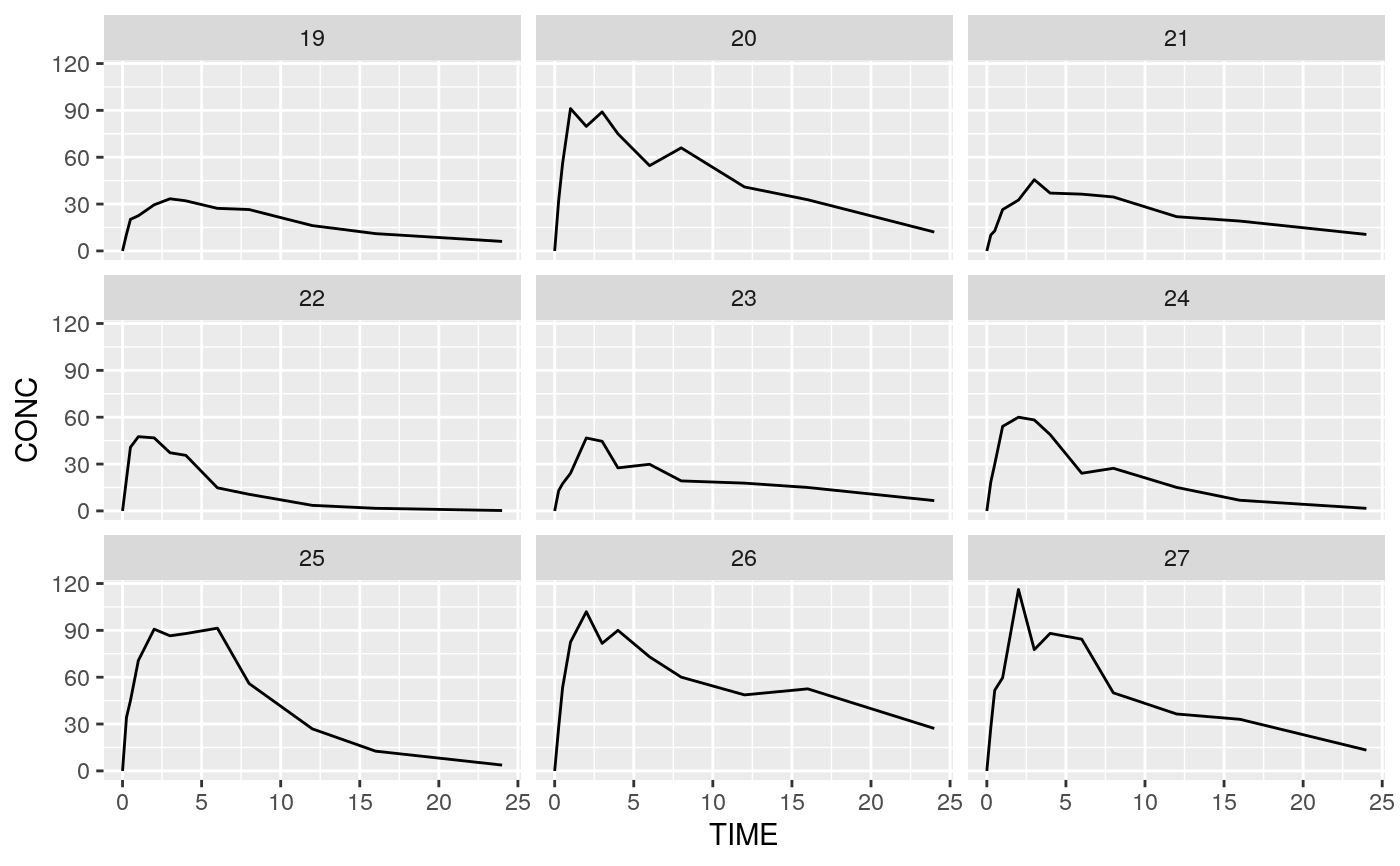
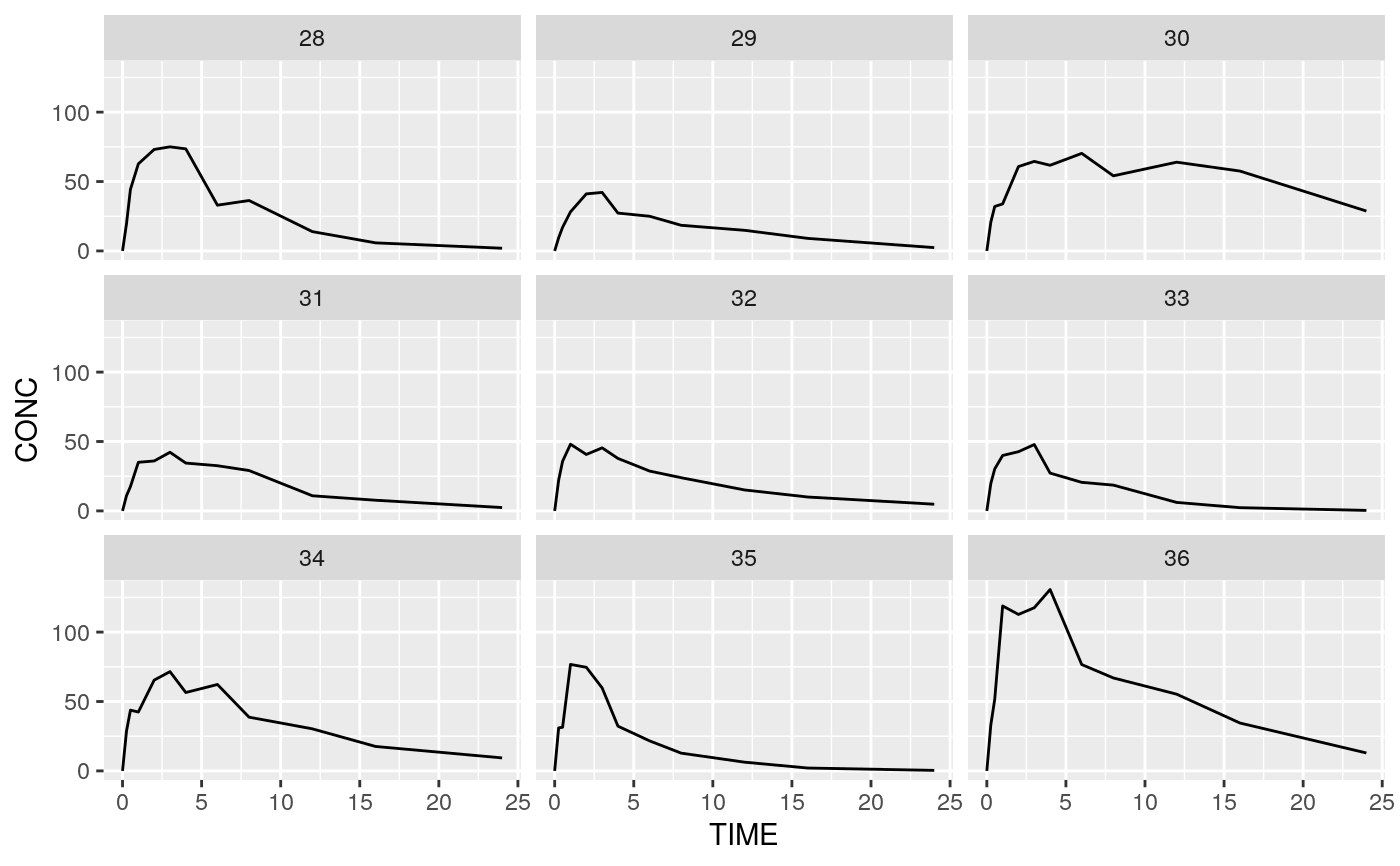
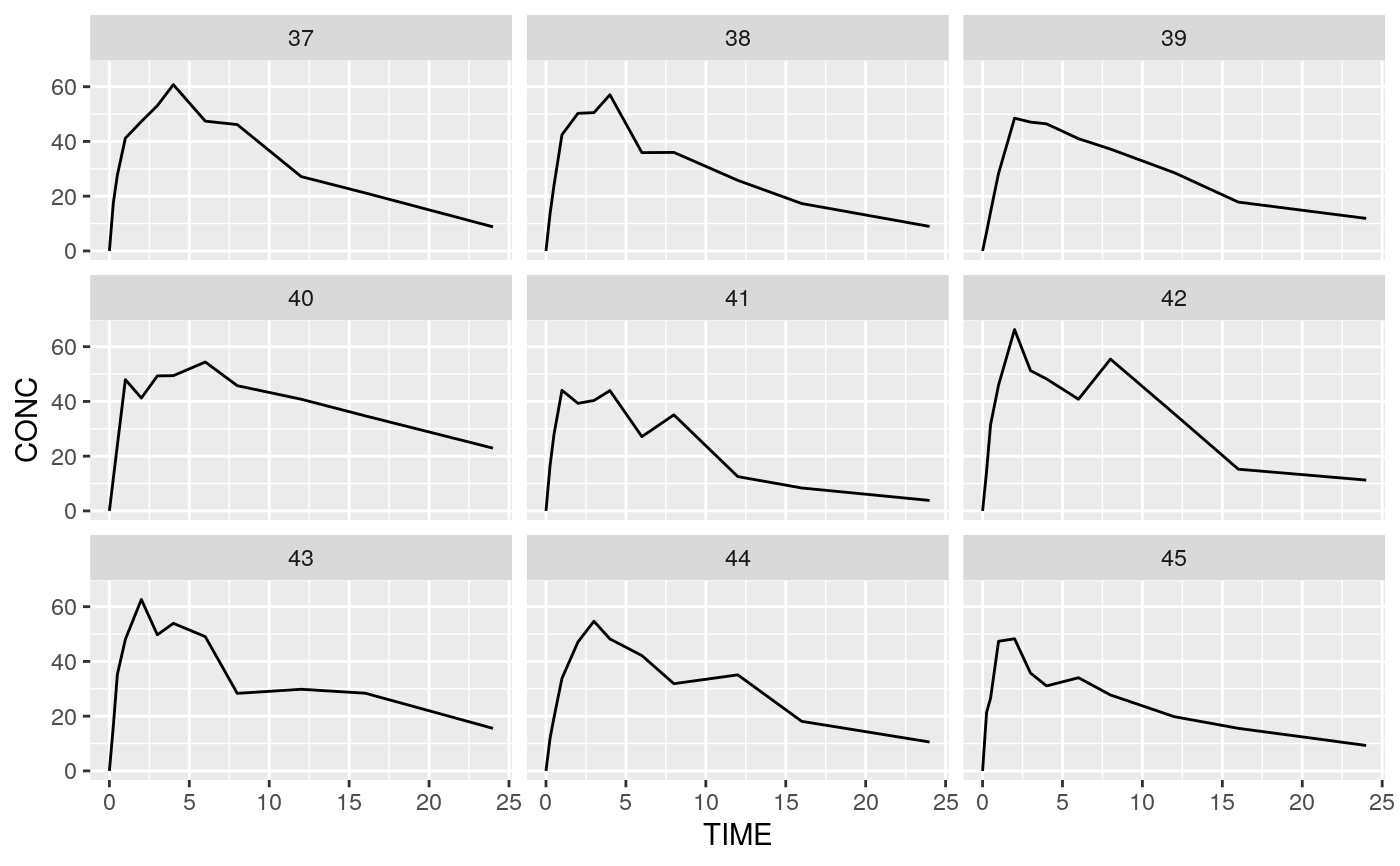
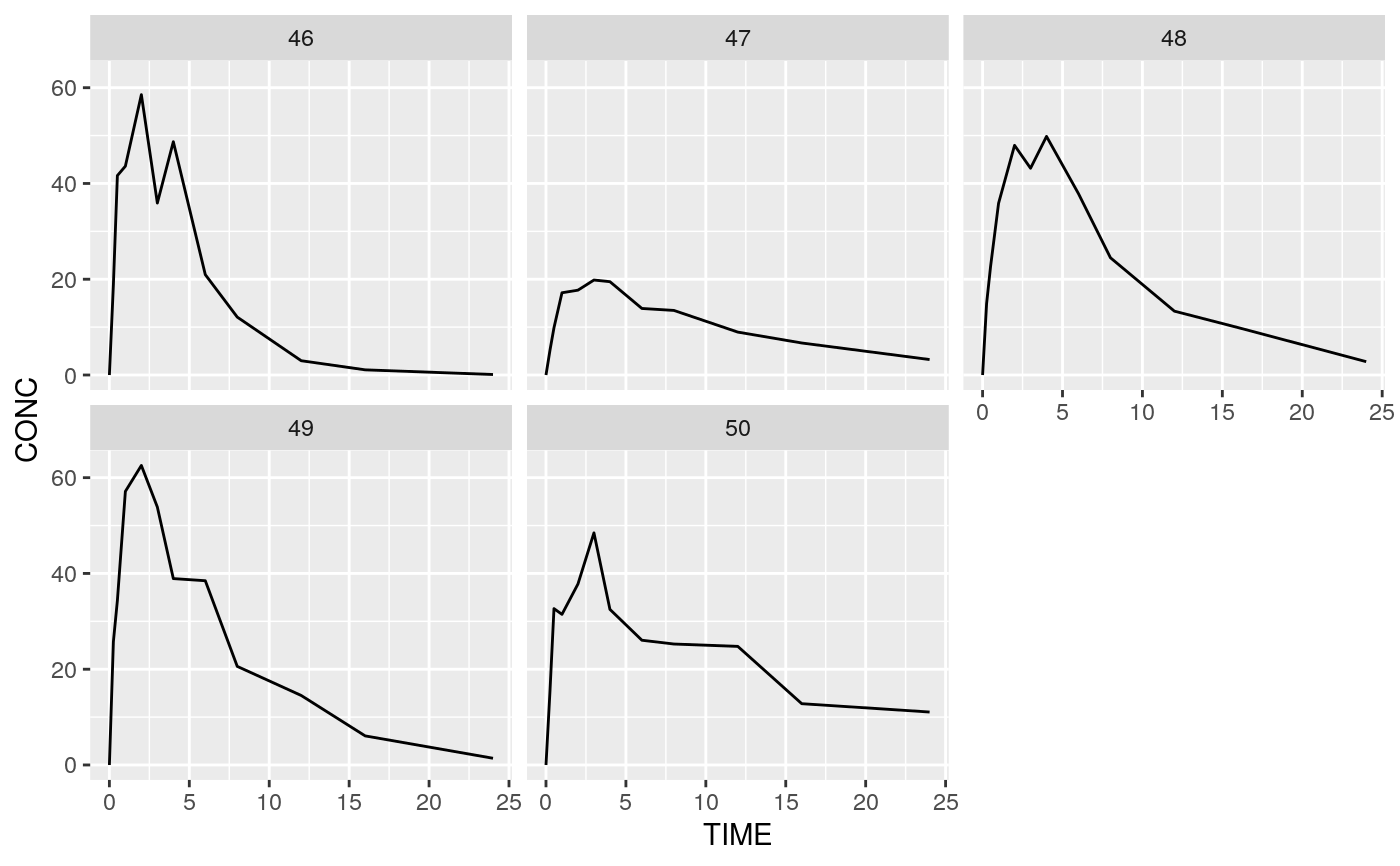
Examples
library(dplyr) library(PKPDmisc) library(ggplot2) # given we may only plot a subset of individuals per plot # and generate multiple plots, lets split the dataframe list_of_ids <- sd_oral_richpk %>% capitalize_names() %>% mutate(plotnum = ids_per_plot(ID)) %>% # default 9 per plot split(.$plotnum) # now we want to plot each subplot plot_list <- list_of_ids %>% lapply(function(df) { df %>% ggplot(aes(x = TIME, y = CONC, group = ID)) + geom_line() + facet_wrap(~ID) }) # to print these out (with one plot per page on pdf) print_plots(plot_list)#> #>#> #>#> #>#> #>#> #>#> #>