The goal of bench is to benchmark code, tracking execution time, memory allocations and garbage collections.
Installation
You can install the release version from CRAN with:
install.packages("bench")Or you can install the development version from GitHub with:
# install.packages("remotes")
remotes::install_github("r-lib/bench")
Features
bench::mark() is used to benchmark one or a series of expressions, we feel it has a number of advantages over alternatives.
- Always uses the highest precision APIs available for each operating system (often nanoseconds).
- Tracks memory allocations for each expression.
- Tracks the number and type of R garbage collections per expression iteration.
- Verifies equality of expression results by default, to avoid accidentally benchmarking inequivalent code.
- Has
bench::press(), which allows you to easily perform and combine benchmarks across a large grid of values. - Uses adaptive stopping by default, running each expression for a set amount of time rather than for a specific number of iterations.
- Expressions are run in batches and summary statistics are calculated after filtering out iterations with garbage collections. This allows you to isolate the performance and effects of garbage collection on running time (for more details see Neal 2014).
The times and memory usage are returned as custom objects which have human readable formatting for display (e.g. 104ns) and comparisons (e.g. x$mem_alloc > "10MB").
There is also full support for plotting with ggplot2 including custom scales and formatting.
Usage
bench::mark()
Benchmarks can be run with bench::mark(), which takes one or more expressions to benchmark against each other.
bench::mark() will throw an error if the results are not equivalent, so you don’t accidentally benchmark inequivalent code.
bench::mark(
  dat[dat$x > 500, ],
  dat[which(dat$x > 499), ],
  subset(dat, x > 500))
#> Error: Each result must equal the first result:
#> `dat[dat$x > 500, ]` does not equal `dat[which(dat$x > 499), ]`
Results are easy to interpret, with human readable units.
bnch <- bench::mark(
  dat[dat$x > 500, ],
  dat[which(dat$x > 500), ],
  subset(dat, x > 500))
bnch
#> # A tibble: 3 × 6
#>   expression                     min   median `itr/sec` mem_alloc `gc/sec`
#>   <bch:expr>                <bch:tm> <bch:tm>     <dbl> <bch:byt>    <dbl>
#> 1 dat[dat$x > 500, ]           309µs    423µs     2392.     377KB     15.0
#> 2 dat[which(dat$x > 500), ]    212µs    279µs     3406.     260KB     14.8
#> 3 subset(dat, x > 500)         380µs    446µs     2141.     510KB     17.9
By default the summary uses absolute measures, however relative results can be obtained by using relative = TRUE in your call to bench::mark() or calling summary(relative = TRUE) on the results.
summary(bnch, relative = TRUE)
#> # A tibble: 3 × 6
#>   expression                  min median `itr/sec` mem_alloc `gc/sec`
#>   <bch:expr>                <dbl>  <dbl>     <dbl>     <dbl>    <dbl>
#> 1 dat[dat$x > 500, ]         1.46   1.52      1.12      1.45     1.01
#> 2 dat[which(dat$x > 500), ]  1      1         1.59      1        1
#> 3 subset(dat, x > 500)       1.79   1.60      1         1.96     1.21
bench::press()
bench::press() is used to run benchmarks against a grid of parameters. Provide setup and benchmarking code as a single unnamed argument then define sets of values as named arguments. The full combination of values will be expanded and the benchmarks are then pressed together in the result. This allows you to benchmark a set of expressions across a wide variety of input sizes, perform replications and other useful tasks.
set.seed(42)

create_df <- function(rows, cols) {
  as.data.frame(setNames(
    replicate(cols, runif(rows, 1, 100), simplify = FALSE),
    rep_len(c("x", letters), cols)))
}

results <- bench::press(
  rows = c(1000, 10000),
  cols = c(2, 10),
  {
    dat <- create_df(rows, cols)
    bench::mark(
      min_iterations = 100,
      bracket = dat[dat$x > 500, ],
      which = dat[which(dat$x > 500), ],
      subset = subset(dat, x > 500)
    )
  }
)
#> Running with:
#>    rows  cols
#> 1  1000     2
#> 2 10000     2
#> 3  1000    10
#> 4 10000    10
results
#> # A tibble: 12 × 8
#>    expression  rows  cols      min   median `itr/sec` mem_alloc `gc/sec`
#>    <bch:expr> <dbl> <dbl> <bch:tm> <bch:tm>     <dbl> <bch:byt>    <dbl>
#>  1 bracket     1000     2   25.3µs     33µs    29008.   15.84KB    11.6
#>  2 which       1000     2   25.5µs   32.5µs    29813.    7.91KB     8.95
#>  3 subset      1000     2   45.8µs   56.7µs    17164.    27.7KB     8.66
#>  4 bracket    10000     2   45.6µs     60µs    16286.  156.46KB    56.1
#>  5 which      10000     2   40.4µs   42.9µs    20583.   78.23KB    31.7
#>  6 subset     10000     2   94.6µs  117.5µs     8158.  273.79KB    49.1
#>  7 bracket     1000    10   64.4µs     77µs    12601.   47.52KB    12.8
#>  8 which       1000    10   58.9µs   63.3µs    14338.    7.91KB    12.4
#>  9 subset      1000    10   85.1µs  104.7µs     8755.   59.38KB    10.7
#> 10 bracket    10000    10  128.9µs  144.6µs     6752.   469.4KB    70.3
#> 11 which      10000    10   89.8µs   97.3µs     9699.   78.23KB    14.8
#> 12 subset     10000    10  189.5µs  232.9µs     4180.  586.73KB    56.8
Plotting
ggplot2::autoplot() can be used to generate an informative default plot. This plot is colored by gc level (0, 1, or 2) and faceted by parameters (if any). By default it generates a beeswarm plot, however you can also specify other plot types (jitter, ridge, boxplot, violin). See ?autoplot.bench_mark for full details.
ggplot2::autoplot(results)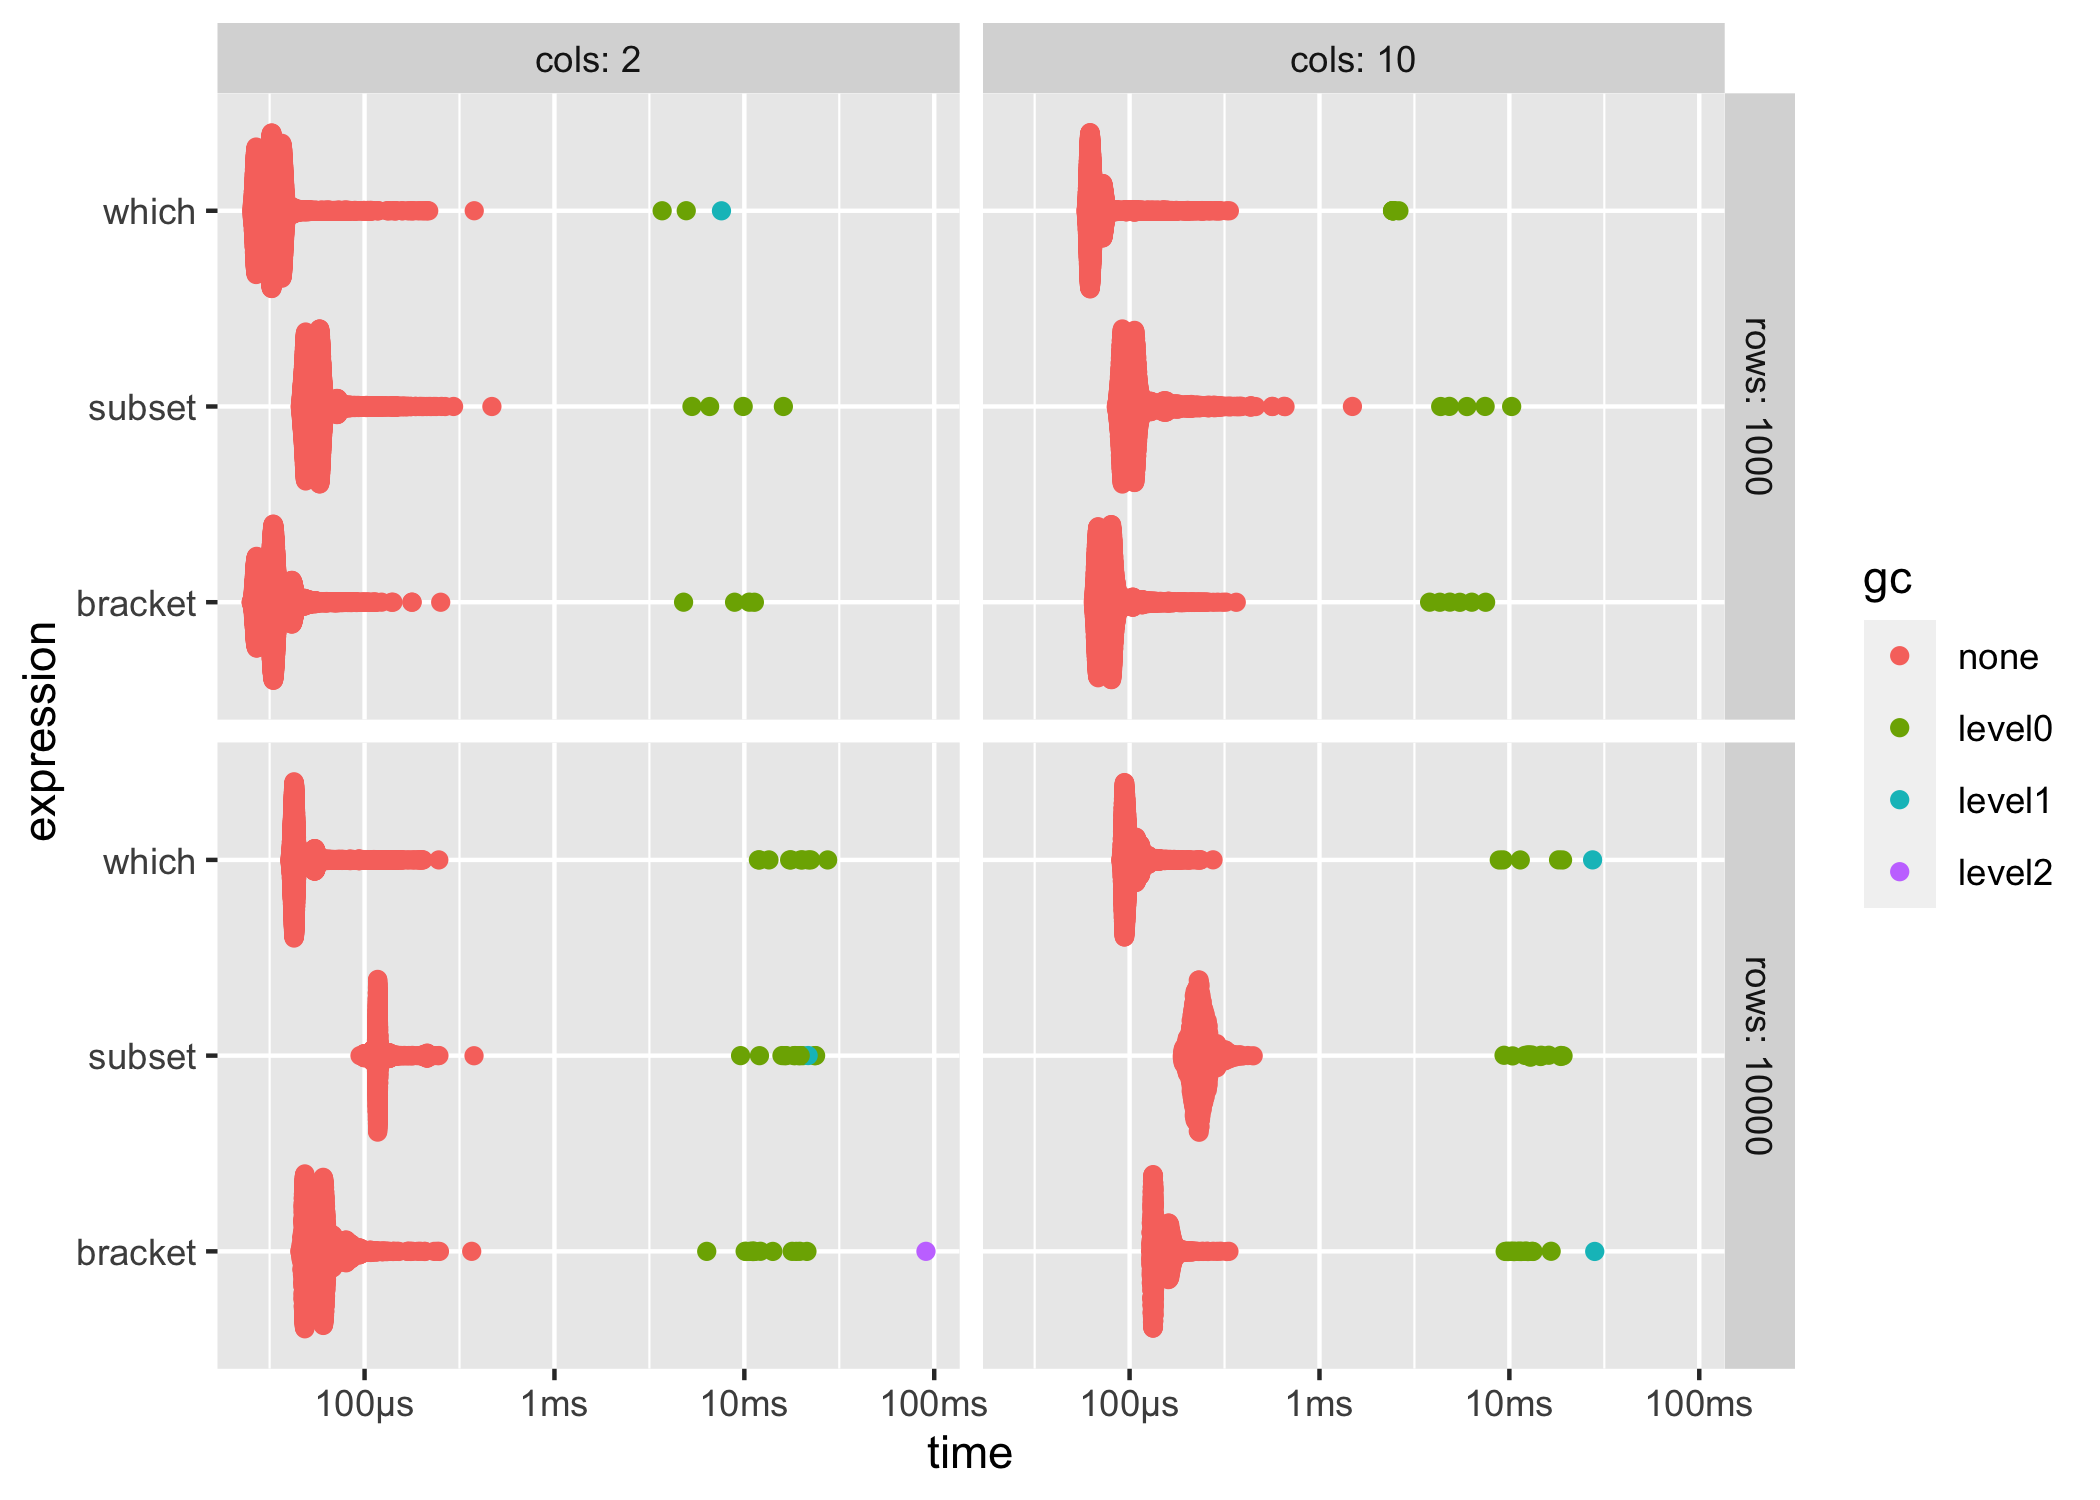
You can also produce fully custom plots by un-nesting the results and working with the data directly.
system_time()
bench also includes system_time(), a higher precision alternative to system.time().
bench::system_time({ i <- 1; while(i < 1e7) i <- i + 1 })
#> process    real
#>   2.58s   2.59s
bench::system_time(Sys.sleep(.5))
#> process    real
#>    73µs   500ms