Tidy summarizes information about the components of a model. A model component might be a single term in a regression, a single hypothesis, a cluster, or a class. Exactly what tidy considers to be a model component varies across models but is usually self-evident. If a model has several distinct types of components, you will need to specify which components to return.
# S3 method for lmodel2
tidy(x, ...)
Arguments
- x
A
lmodel2object returned bylmodel2::lmodel2().- ...
Additional arguments. Not used. Needed to match generic signature only. Cautionary note: Misspelled arguments will be absorbed in
..., where they will be ignored. If the misspelled argument has a default value, the default value will be used. For example, if you passconf.lvel = 0.9, all computation will proceed usingconf.level = 0.95. Additionally, if you passnewdata = my_tibbleto anaugment()method that does not accept anewdataargument, it will use the default value for thedataargument.
Details
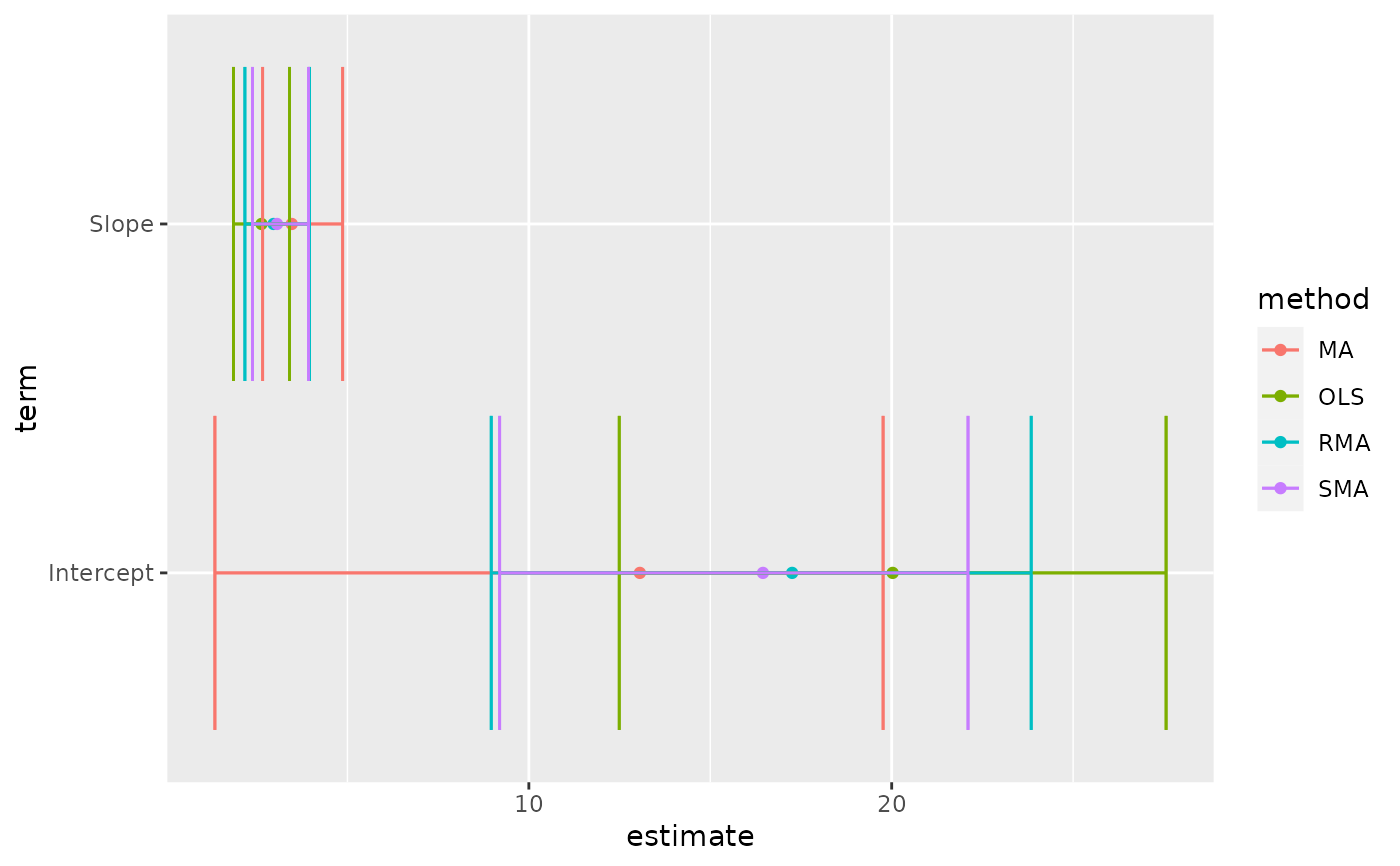
There are always only two terms in an lmodel2: "Intercept"
and "Slope". These are computed by four methods: OLS
(ordinary least squares), MA (major axis), SMA (standard major
axis), and RMA (ranged major axis).
The returned p-value is one-tailed and calculated via a permutation test.
A permutational test is used because distributional assumptions may not
be valid. More information can be found in
vignette("mod2user", package = "lmodel2").
See also
Other lmodel2 tidiers:
glance.lmodel2()
Value
A tibble::tibble() with columns:
- conf.high
Upper bound on the confidence interval for the estimate.
- conf.low
Lower bound on the confidence interval for the estimate.
- estimate
The estimated value of the regression term.
- p.value
The two-sided p-value associated with the observed statistic.
- term
The name of the regression term.
- method
Either OLS/MA/SMA/RMA
Examples
# feel free to ignore the following line—it allows {broom} to supply
# examples without requiring the model-supplying package to be installed.
if (requireNamespace("lmodel2", quietly = TRUE)) {

# load libraries for models and data
library(lmodel2)

data(mod2ex2)
Ex2.res <- lmodel2(Prey ~ Predators, data = mod2ex2, "relative", "relative", 99)
Ex2.res

# summarize model fit with tidiers + visualization
tidy(Ex2.res)
glance(Ex2.res)

# this allows coefficient plots with ggplot2
library(ggplot2)

ggplot(tidy(Ex2.res), aes(estimate, term, color = method)) +
  geom_point() +
  geom_errorbarh(aes(xmin = conf.low, xmax = conf.high)) +
  geom_errorbarh(aes(xmin = conf.low, xmax = conf.high))

}