Tidy summarizes information about the components of a model. A model component might be a single term in a regression, a single hypothesis, a cluster, or a class. Exactly what tidy considers to be a model component varies across models but is usually self-evident. If a model has several distinct types of components, you will need to specify which components to return.
# S3 method for power.htest
tidy(x, ...)
Arguments
- x
A
power.htestobject such as those returned fromstats::power.t.test().- ...
Additional arguments. Not used. Needed to match generic signature only. Cautionary note: Misspelled arguments will be absorbed in
..., where they will be ignored. If the misspelled argument has a default value, the default value will be used. For example, if you passconf.lvel = 0.9, all computation will proceed usingconf.level = 0.95. Additionally, if you passnewdata = my_tibbleto anaugment()method that does not accept anewdataargument, it will use the default value for thedataargument.
See also
Other htest tidiers:
augment.htest(),
tidy.htest(),
tidy.pairwise.htest()
Value
A tibble::tibble() with columns:
- delta
True difference in means.
- n
Number of observations by component.
- power
Power achieved for given value of n.
- sd
Standard deviation.
- sig.level
Significance level (Type I error probability).
Examples
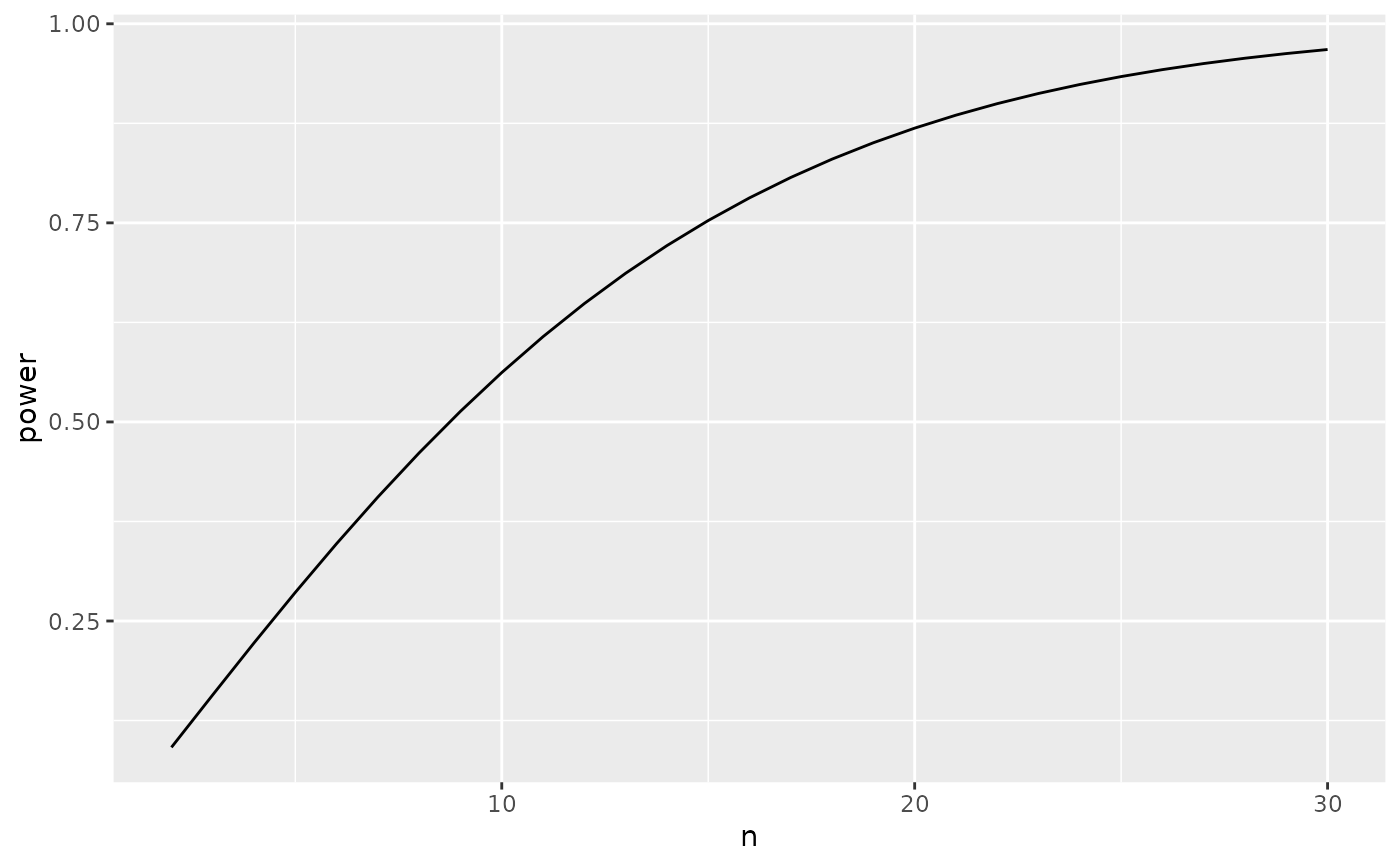
ptt <- power.t.test(n = 2:30, delta = 1)
tidy(ptt)
#> # A tibble: 29 × 5
#>        n delta    sd sig.level  power
#>    <int> <dbl> <dbl>     <dbl>  <dbl>
#>  1     2     1     1      0.05 0.0913
#>  2     3     1     1      0.05 0.157
#>  3     4     1     1      0.05 0.222
#>  4     5     1     1      0.05 0.286
#>  5     6     1     1      0.05 0.347
#>  6     7     1     1      0.05 0.406
#>  7     8     1     1      0.05 0.461
#>  8     9     1     1      0.05 0.513
#>  9    10     1     1      0.05 0.562
#> 10    11     1     1      0.05 0.607
#> # … with 19 more rows

library(ggplot2)

ggplot(tidy(ptt), aes(n, power)) +
  geom_line()