This data is a subset of the NOAA Atlantic hurricane database best track data, https://www.nhc.noaa.gov/data/#hurdat. The data includes the positions and attributes of storms from 1975-2020, measured every six hours during the lifetime of a storm.
stormsFormat
A tibble with 11,859 observations and 13 variables:
- name
Storm Name
- year,month,day
Date of report
- hour
Hour of report (in UTC)
- lat,long
Location of storm center
- status
Storm classification (Tropical Depression, Tropical Storm, or Hurricane)
- category
Saffir-Simpson storm category (estimated from wind speed. -1 = Tropical Depression, 0 = Tropical Storm)
- wind
storm's maximum sustained wind speed (in knots)
- pressure
Air pressure at the storm's center (in millibars)
- tropicalstorm_force_diameter
Diameter (in nautical miles) of the area experiencing tropical storm strength winds (34 knots or above)
- hurricane_force_diameter
Diameter (in nautical miles) of the area experiencing hurricane strength winds (64 knots or above)
See also
The script to create the storms data set: https://github.com/tidyverse/dplyr/blob/main/data-raw/storms.R
Examples
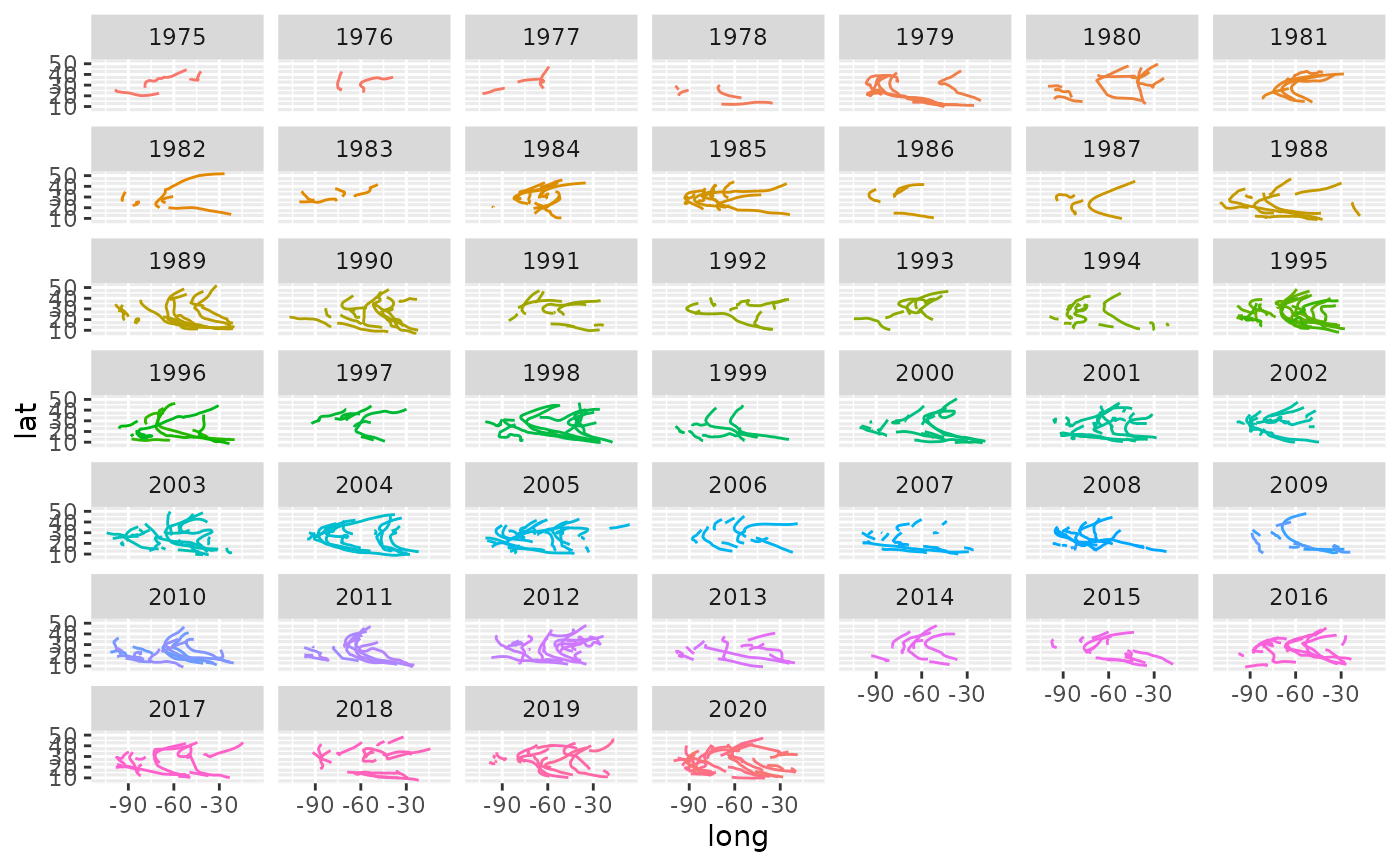
# show a plot of the storm paths
if (requireNamespace("ggplot2", quietly = TRUE)) {
  library(ggplot2)
  ggplot(storms) +
    aes(x=long, y=lat, color=paste(year, name)) +
    geom_path() +
    guides(color='none') +
    facet_wrap(~year)
}


storms
#> # A tibble: 11,859 × 13
#>    name   year month   day  hour   lat  long status      category  wind pressure
#>    <chr> <dbl> <dbl> <int> <dbl> <dbl> <dbl> <chr>       <ord>    <int>    <int>
#>  1 Amy    1975     6    27     0  27.5 -79   tropical d… -1          25     1013
#>  2 Amy    1975     6    27     6  28.5 -79   tropical d… -1          25     1013
#>  3 Amy    1975     6    27    12  29.5 -79   tropical d… -1          25     1013
#>  4 Amy    1975     6    27    18  30.5 -79   tropical d… -1          25     1013
#>  5 Amy    1975     6    28     0  31.5 -78.8 tropical d… -1          25     1012
#>  6 Amy    1975     6    28     6  32.4 -78.7 tropical d… -1          25     1012
#>  7 Amy    1975     6    28    12  33.3 -78   tropical d… -1          25     1011
#>  8 Amy    1975     6    28    18  34   -77   tropical d… -1          30     1006
#>  9 Amy    1975     6    29     0  34.4 -75.8 tropical s… 0           35     1004
#> 10 Amy    1975     6    29     6  34   -74.8 tropical s… 0           40     1002
#> # … with 11,849 more rows, and 2 more variables:
#> #   tropicalstorm_force_diameter <int>, hurricane_force_diameter <int>
storms
#> # A tibble: 11,859 × 13
#> name year month day hour lat long status category wind pressure
#> <chr> <dbl> <dbl> <int> <dbl> <dbl> <dbl> <chr> <ord> <int> <int>
#> 1 Amy 1975 6 27 0 27.5 -79 tropical d… -1 25 1013
#> 2 Amy 1975 6 27 6 28.5 -79 tropical d… -1 25 1013
#> 3 Amy 1975 6 27 12 29.5 -79 tropical d… -1 25 1013
#> 4 Amy 1975 6 27 18 30.5 -79 tropical d… -1 25 1013
#> 5 Amy 1975 6 28 0 31.5 -78.8 tropical d… -1 25 1012
#> 6 Amy 1975 6 28 6 32.4 -78.7 tropical d… -1 25 1012
#> 7 Amy 1975 6 28 12 33.3 -78 tropical d… -1 25 1011
#> 8 Amy 1975 6 28 18 34 -77 tropical d… -1 30 1006
#> 9 Amy 1975 6 29 0 34.4 -75.8 tropical s… 0 35 1004
#> 10 Amy 1975 6 29 6 34 -74.8 tropical s… 0 40 1002
#> # … with 11,849 more rows, and 2 more variables:
#> # tropicalstorm_force_diameter <int>, hurricane_force_diameter <int>