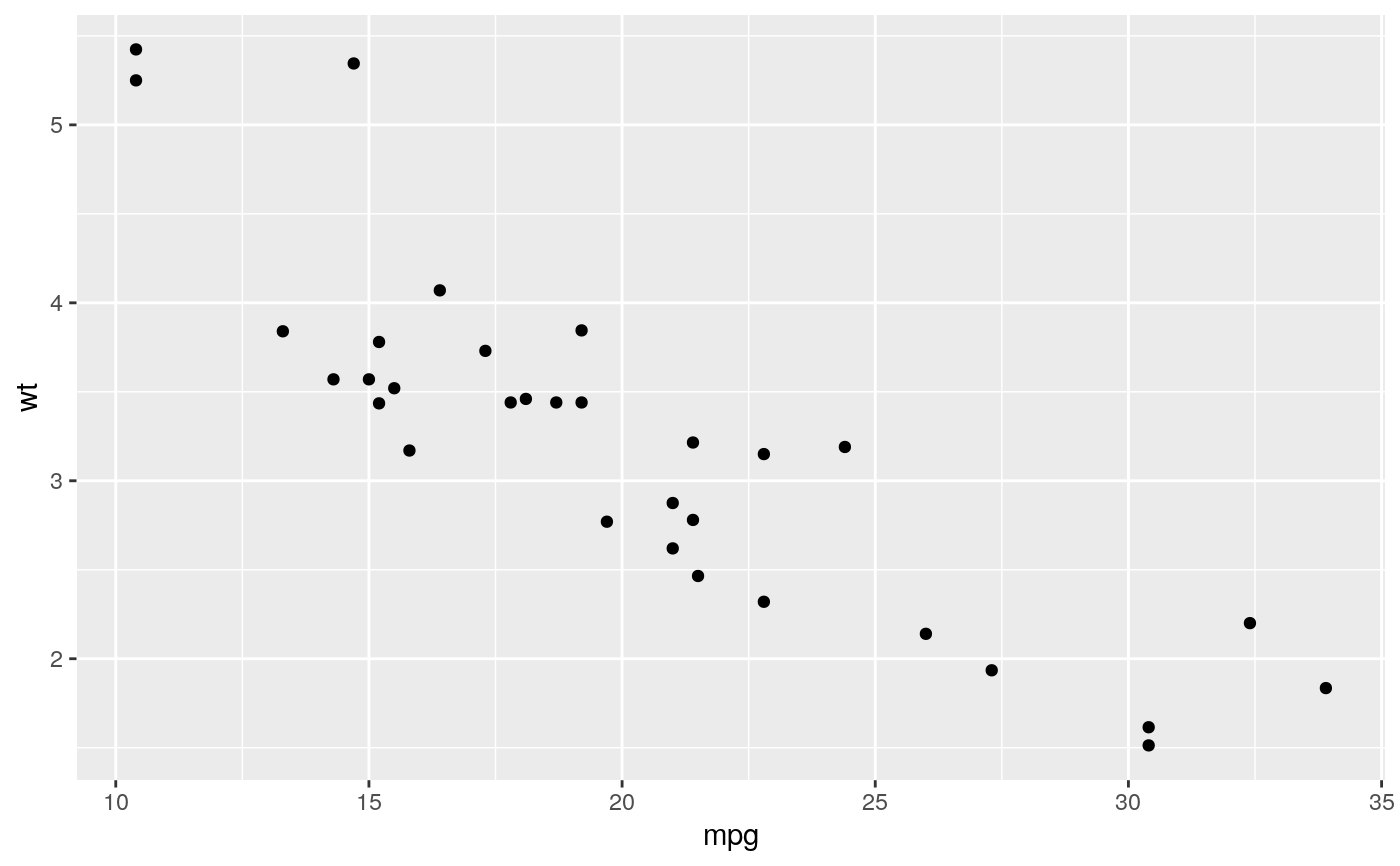
Benchmark plot creation time. Broken down into construct, build, render and draw times.
Source:R/bench.r
benchplot.RdBenchmark plot creation time. Broken down into construct, build, render and draw times.
benchplot(x)
Arguments
| x | code to create ggplot2 plot |
|---|
Examples
#> step user.self sys.self elapsed #> 1 construct 0.003 0 0.002 #> 2 build 0.013 0 0.013 #> 3 render 0.026 0 0.026 #> 4 draw 0.029 0 0.029 #> 5 TOTAL 0.071 0 0.070#> step user.self sys.self elapsed #> 1 construct 0.002 0 0.002 #> 2 build 0.044 0 0.043 #> 3 render 0.073 0 0.073 #> 4 draw 0.050 0 0.049 #> 5 TOTAL 0.169 0 0.167#> step user.self sys.self elapsed #> 1 construct 0.002 0 0.002 #> 2 build 0.012 0 0.012 #> 3 render 0.026 0 0.025 #> 4 draw 0.029 0 0.030 #> 5 TOTAL 0.069 0 0.069
