Colour scales for continuous data default to the values of the
ggplot2.continuous.colour and ggplot2.continuous.fill options. If these
options are not present, "gradient" will be used. See options() for more
information.
scale_colour_continuous(
  ...,
  type = getOption("ggplot2.continuous.colour", default = "gradient")
)

scale_fill_continuous(
  ...,
  type = getOption("ggplot2.continuous.fill", default = "gradient")
)
Arguments
| ... | Additional parameters passed on to the scale type |
|---|---|
| type | One of "gradient" (the default) or "viridis" indicating the colour scale to use |
Color Blindness
Many color palettes derived from RGB combinations (like the "rainbow" color
palette) are not suitable to support all viewers, especially those with
color vision deficiencies. Using viridis type, which is perceptually
uniform in both colour and black-and-white display is an easy option to
ensure good perceptive properties of your visulizations.
The colorspace package offers functionalities
to generate color palettes with good perceptive properties,
to analyse a given color palette, like emulating color blindness,
and to modify a given color palette for better perceptivity.
For more information on color vision deficiencies and suitable color choices see the paper on the colorspace package and references therein.
See also
scale_colour_gradient(), scale_colour_viridis_c(),
scale_colour_steps(), scale_colour_viridis_b(), scale_fill_gradient(),
scale_fill_viridis_c(), scale_fill_steps(), and scale_fill_viridis_b()
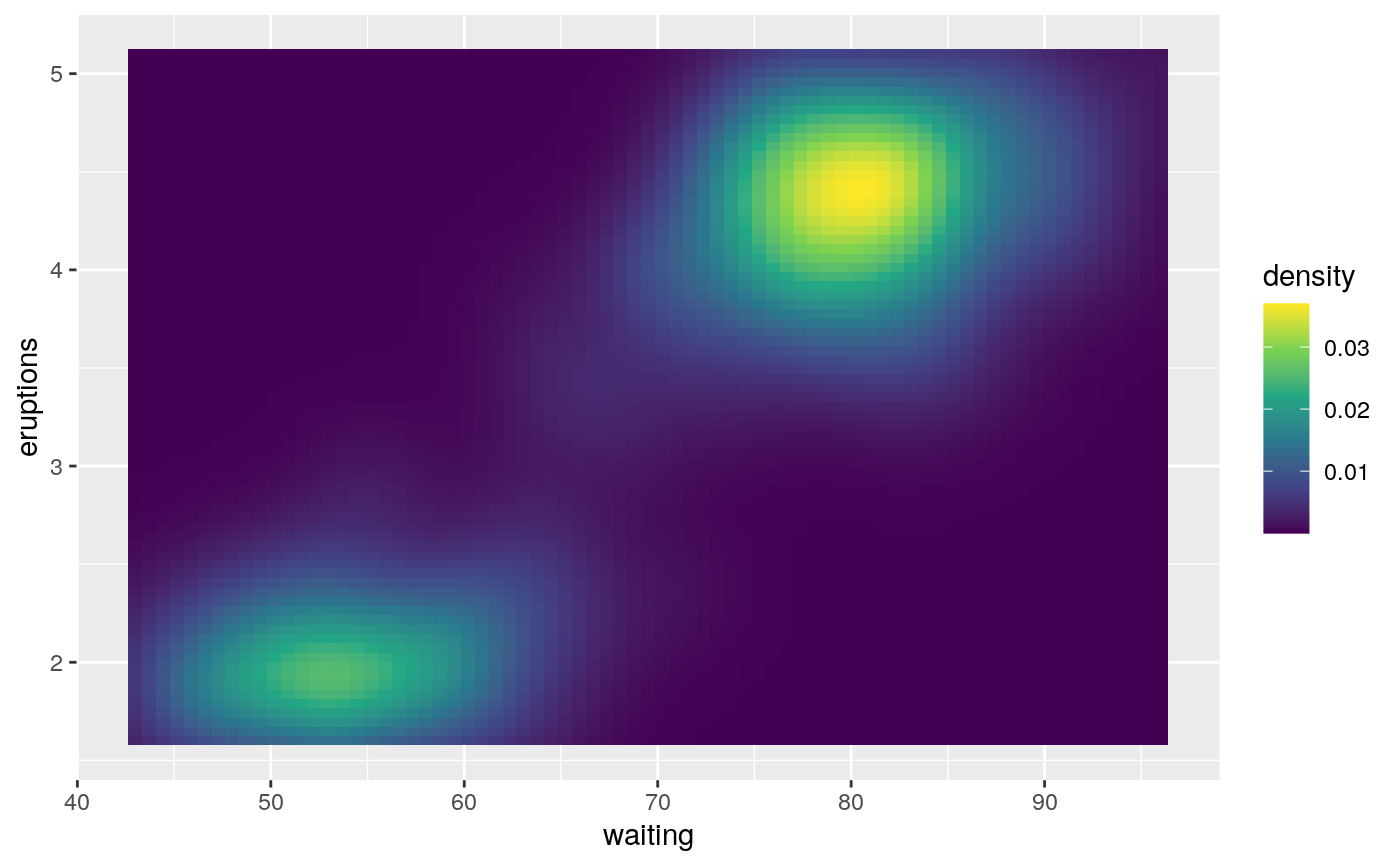
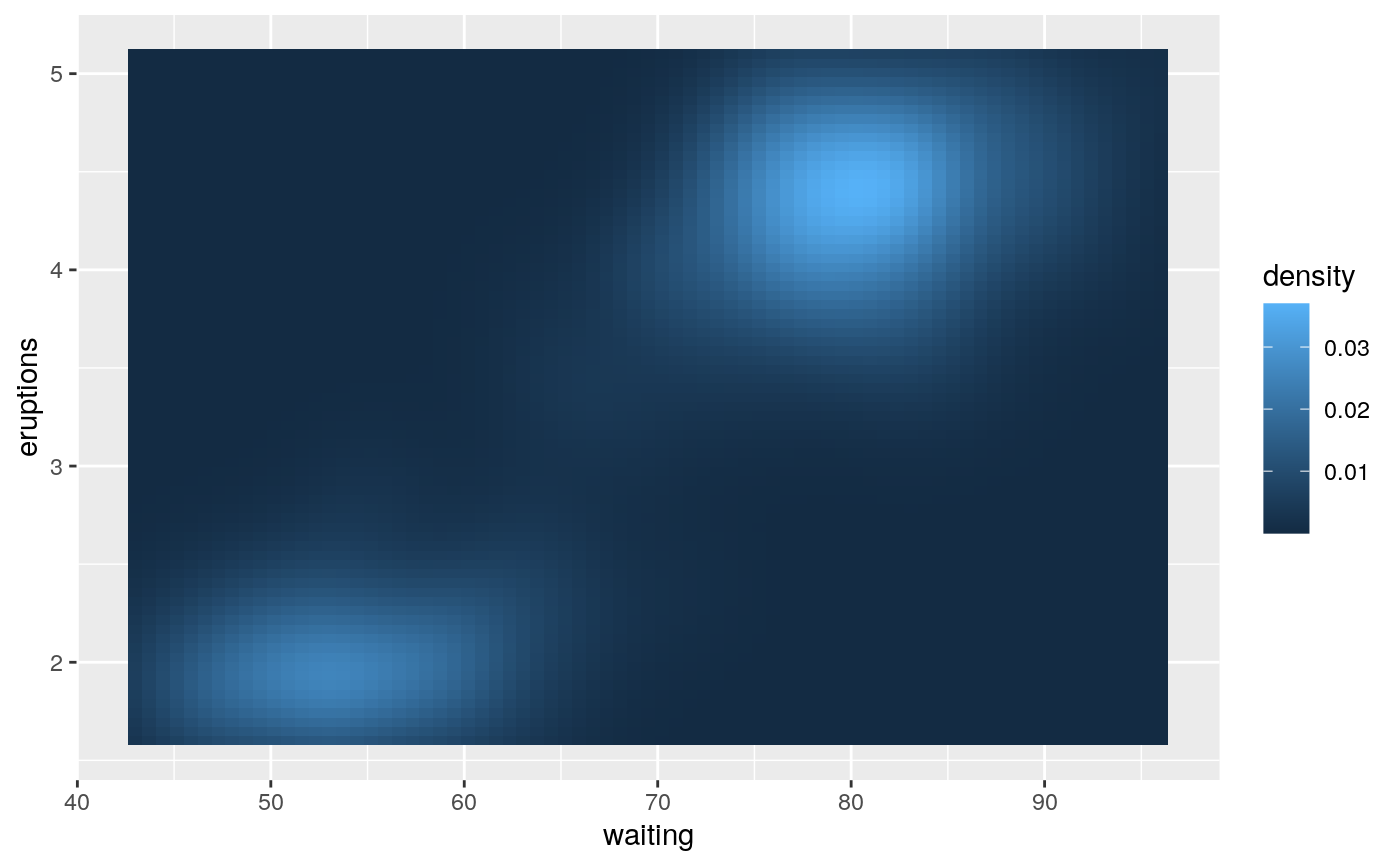
Examples
v + scale_fill_continuous(type = "gradient")v + scale_fill_continuous(type = "viridis")v + scale_fill_viridis_c()