A layer is a combination of data, stat and geom with a potential position
adjustment. Usually layers are created using geom_* or stat_*
calls but it can also be created directly using this function.
layer(
  geom = NULL,
  stat = NULL,
  data = NULL,
  mapping = NULL,
  position = NULL,
  params = list(),
  inherit.aes = TRUE,
  check.aes = TRUE,
  check.param = TRUE,
  show.legend = NA,
  key_glyph = NULL,
  layer_class = Layer
)
Arguments
| geom | The geometric object to use display the data |
|---|---|
| stat | The statistical transformation to use on the data for this layer, as a string. |
| data | The data to be displayed in this layer. There are three options: If A A |
| mapping | Set of aesthetic mappings created by |
| position | Position adjustment, either as a string, or the result of a call to a position adjustment function. |
| params | Additional parameters to the |
| inherit.aes | If |
| check.aes, check.param | If |
| show.legend | logical. Should this layer be included in the legends?
|
| key_glyph | A legend key drawing function or a string providing the
function name minus the |
| layer_class | The type of layer object to be constructued. This is intended for ggplot2 internal use only. |
Examples
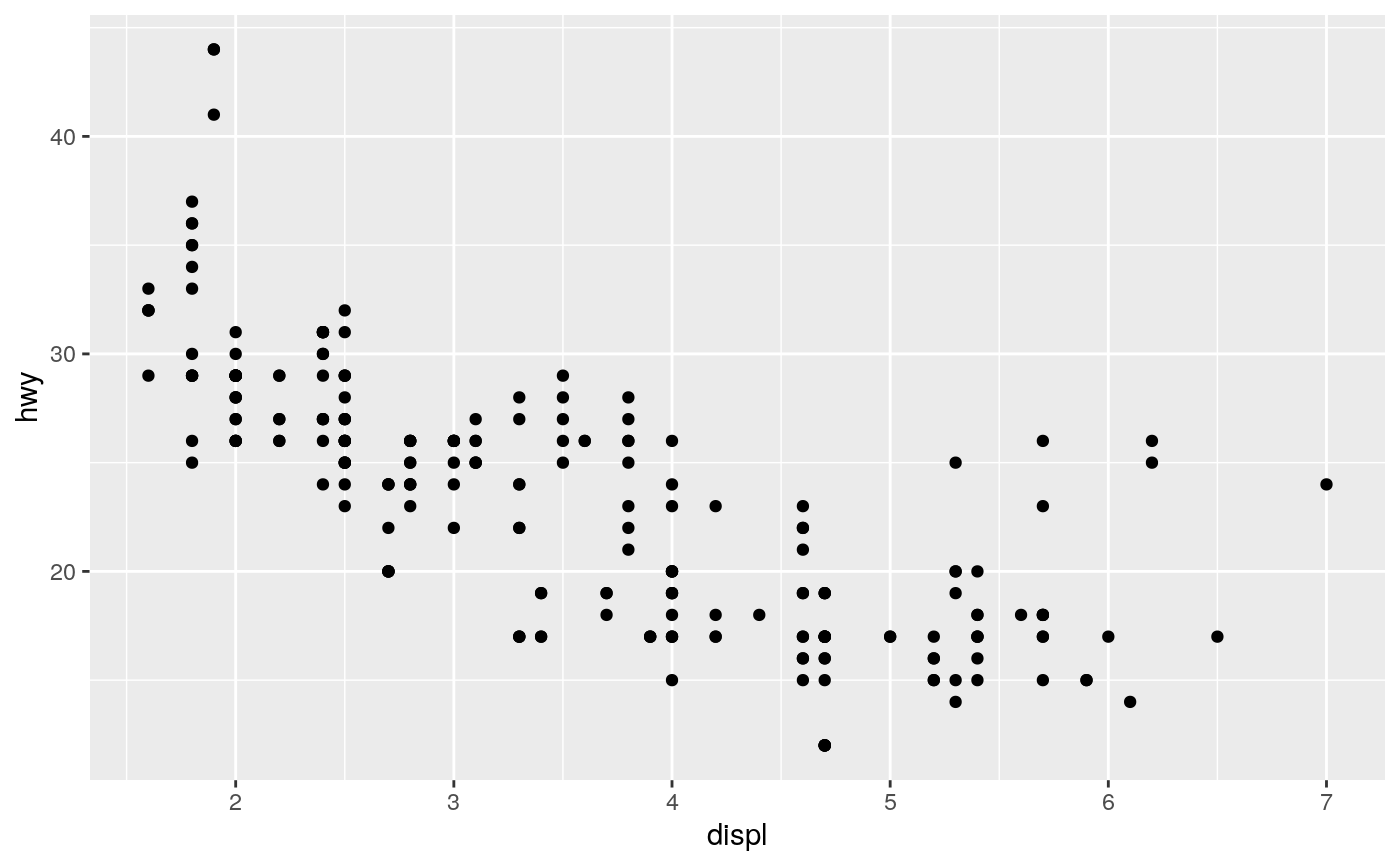
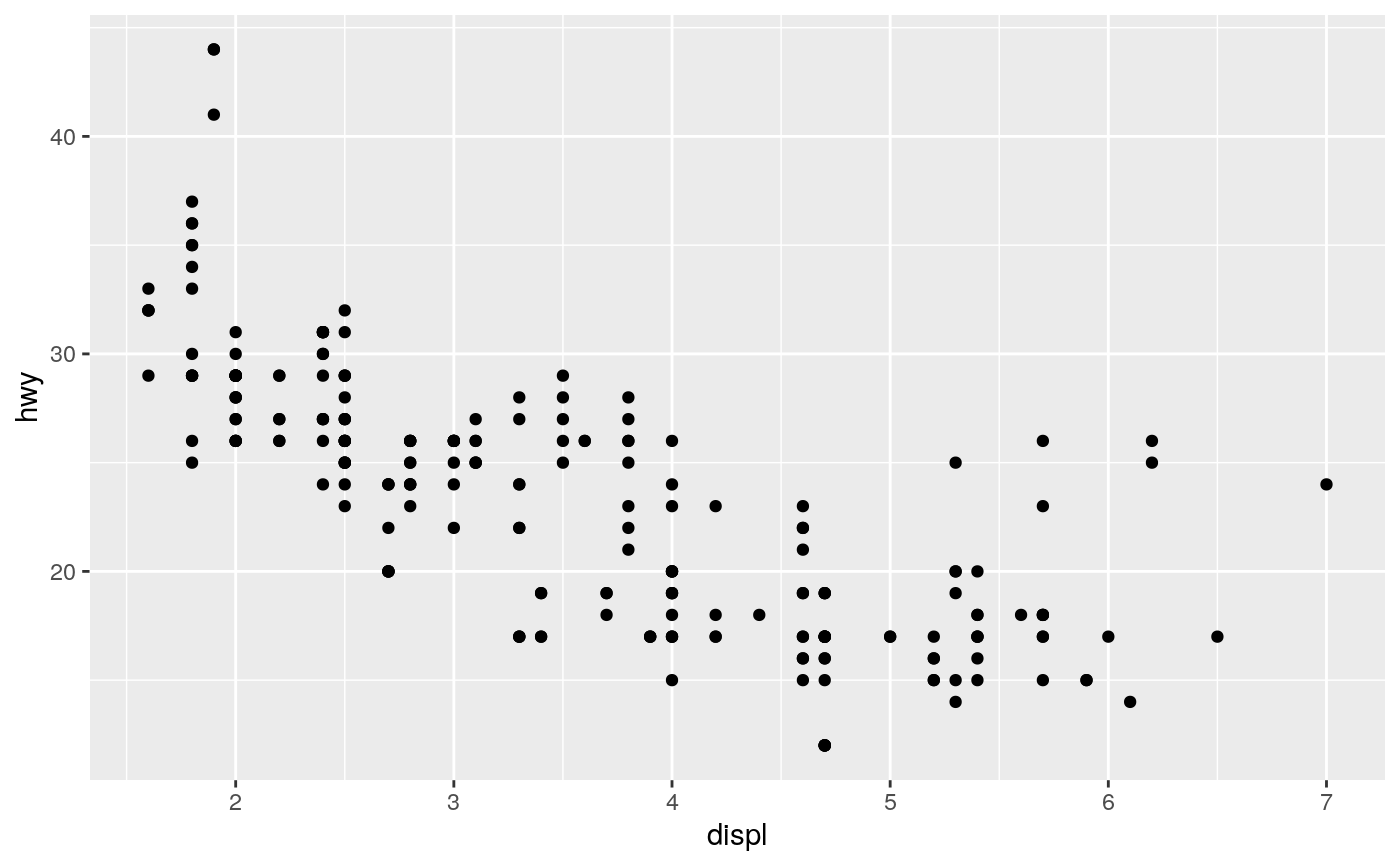
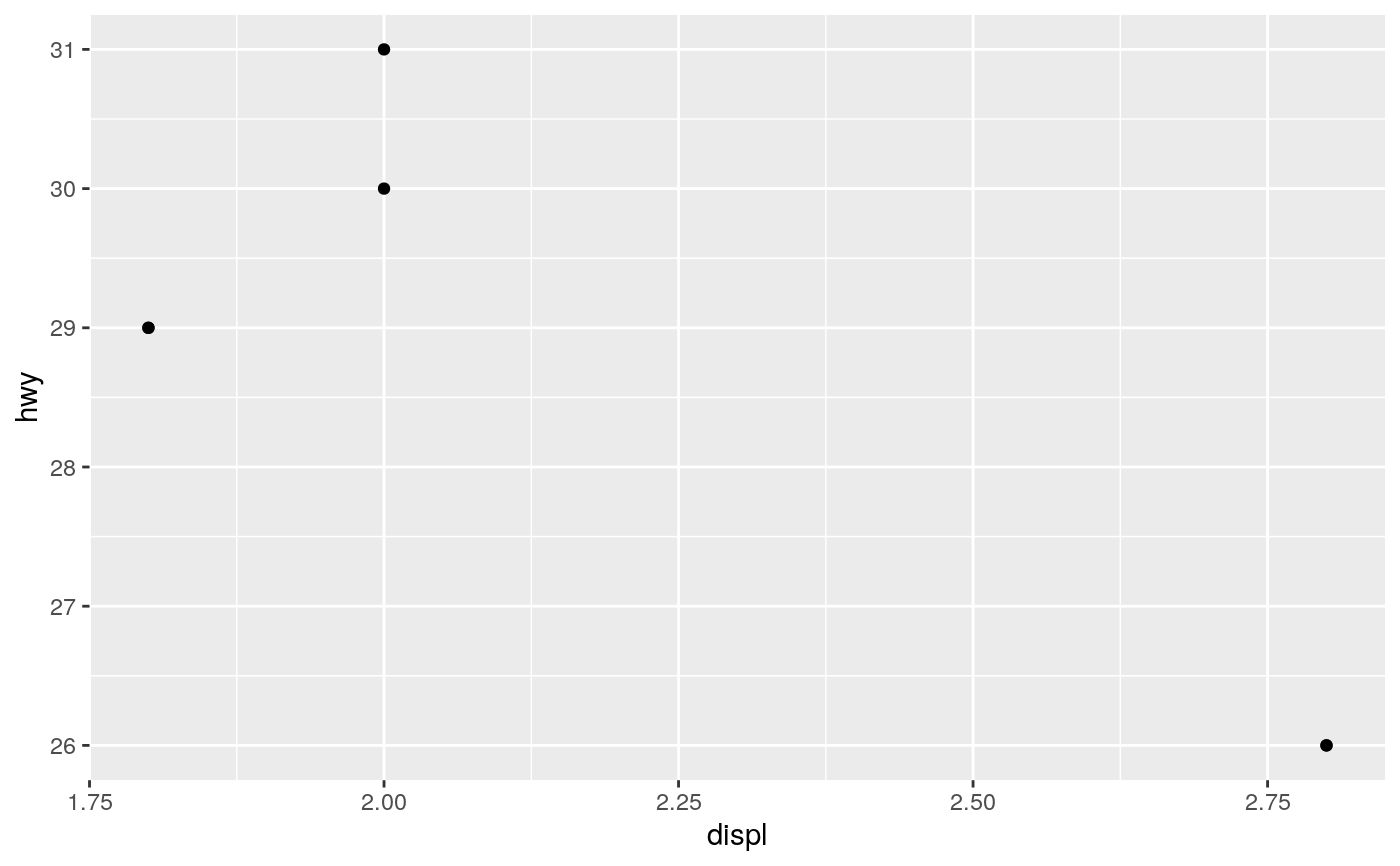
# shortcut for ggplot(mpg, aes(displ, hwy)) + layer(geom = "point", stat = "identity", position = "identity", params = list(na.rm = FALSE) )# use a function as data to plot a subset of global data ggplot(mpg, aes(displ, hwy)) + layer(geom = "point", stat = "identity", position = "identity", data = head, params = list(na.rm = FALSE) )


