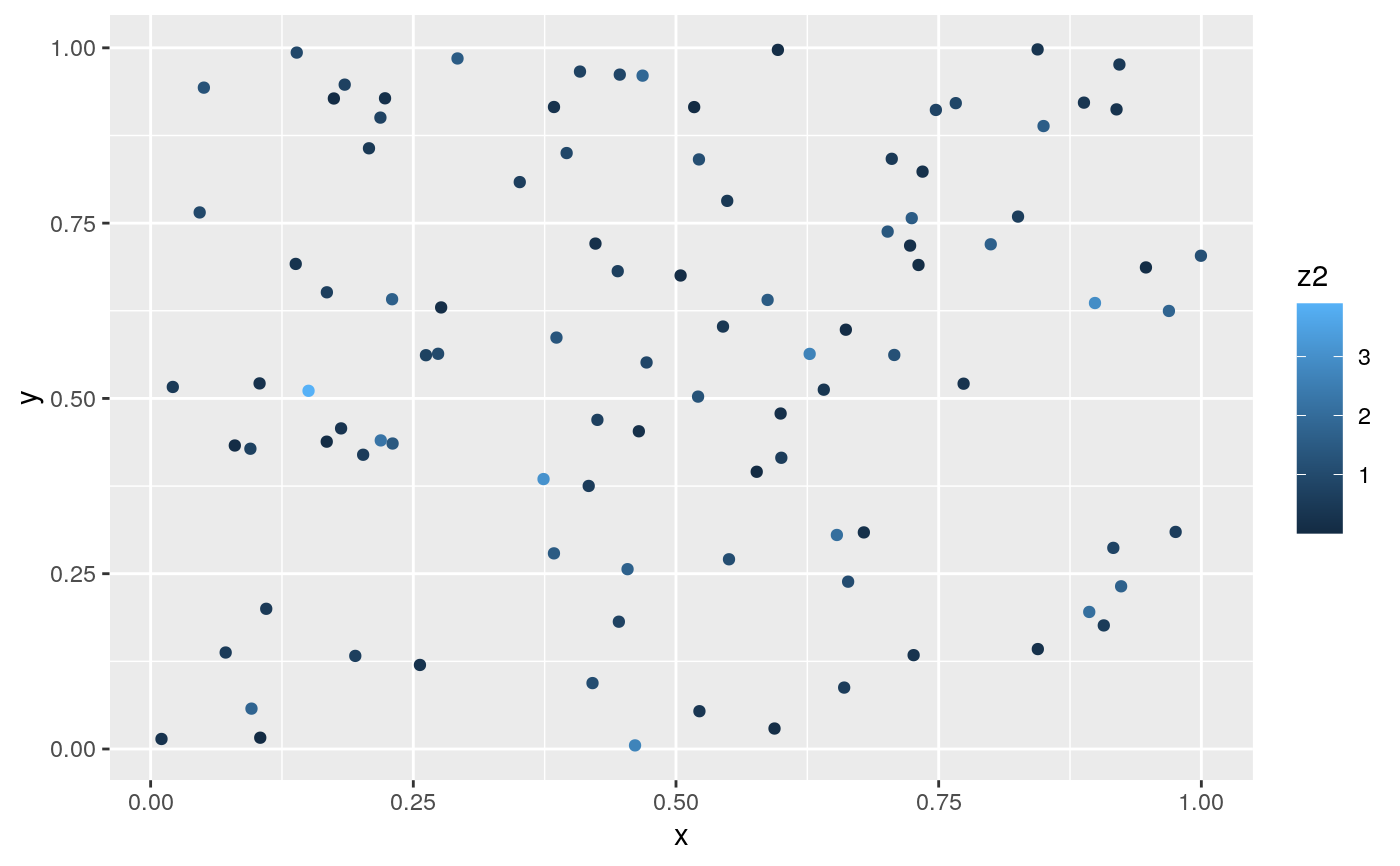
scale_*_gradient creates a two colour gradient (low-high),
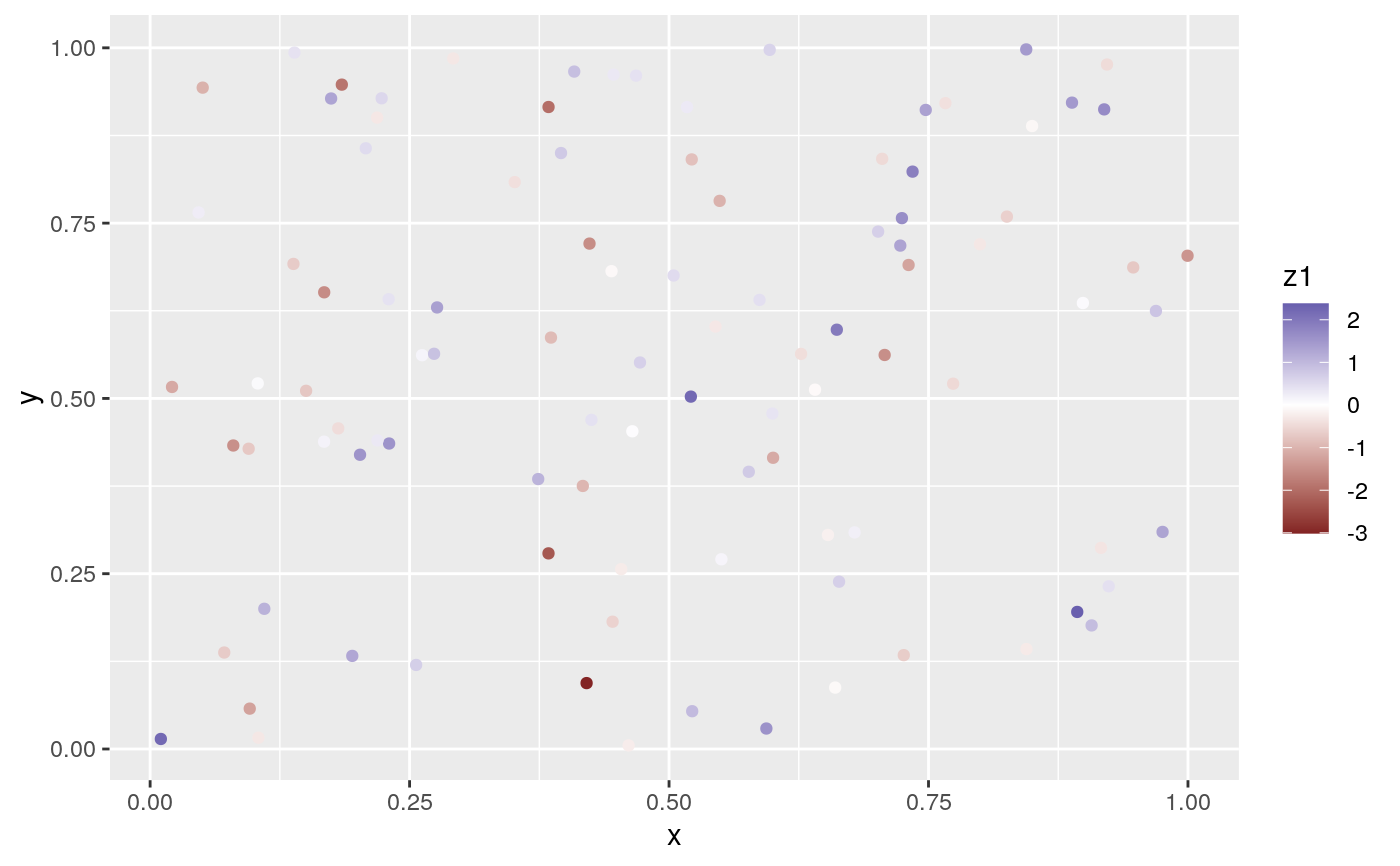
scale_*_gradient2 creates a diverging colour gradient (low-mid-high),
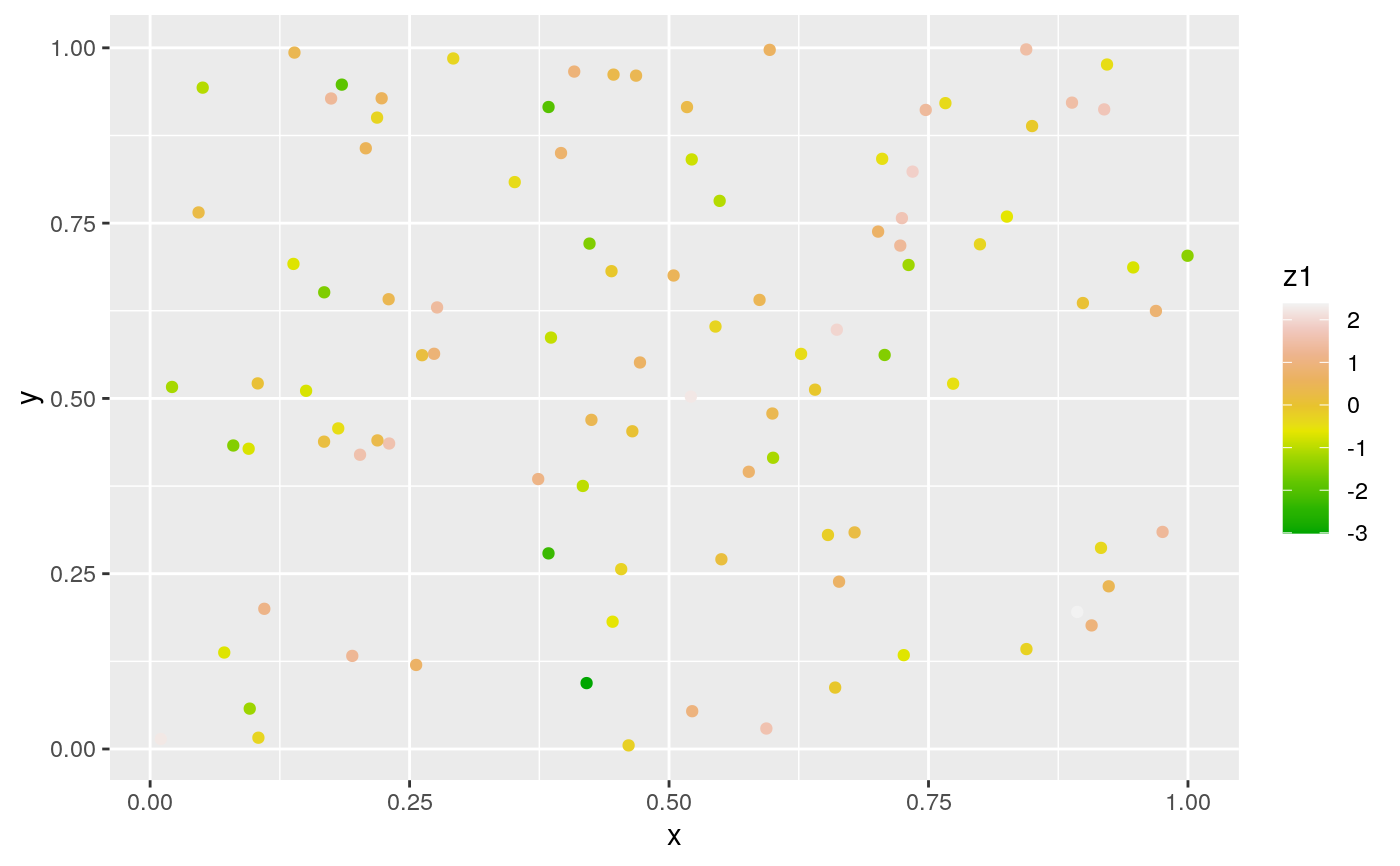
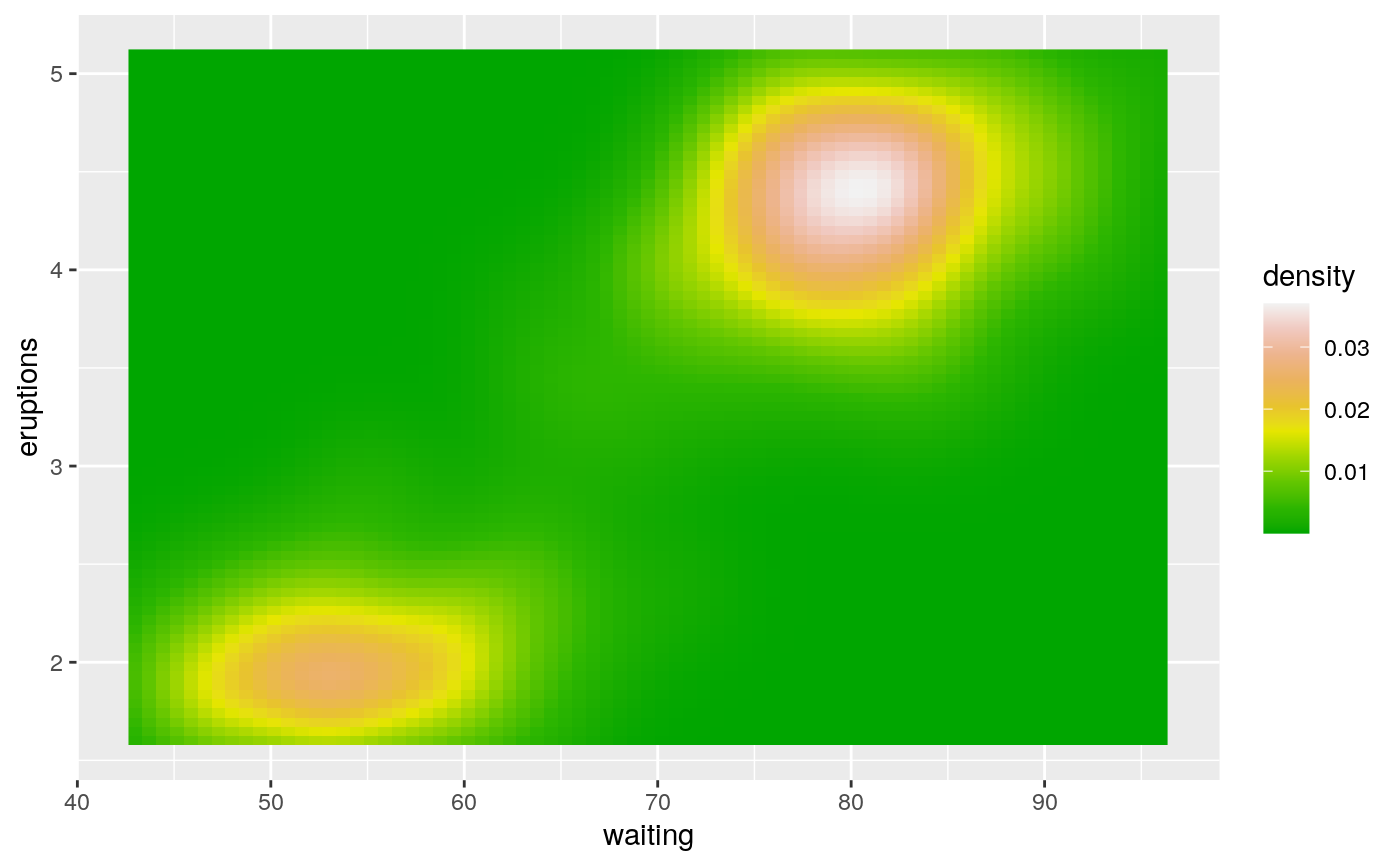
scale_*_gradientn creates a n-colour gradient.
scale_colour_gradient(
  ...,
  low = "#132B43",
  high = "#56B1F7",
  space = "Lab",
  na.value = "grey50",
  guide = "colourbar",
  aesthetics = "colour"
)

scale_fill_gradient(
  ...,
  low = "#132B43",
  high = "#56B1F7",
  space = "Lab",
  na.value = "grey50",
  guide = "colourbar",
  aesthetics = "fill"
)

scale_colour_gradient2(
  ...,
  low = muted("red"),
  mid = "white",
  high = muted("blue"),
  midpoint = 0,
  space = "Lab",
  na.value = "grey50",
  guide = "colourbar",
  aesthetics = "colour"
)

scale_fill_gradient2(
  ...,
  low = muted("red"),
  mid = "white",
  high = muted("blue"),
  midpoint = 0,
  space = "Lab",
  na.value = "grey50",
  guide = "colourbar",
  aesthetics = "fill"
)

scale_colour_gradientn(
  ...,
  colours,
  values = NULL,
  space = "Lab",
  na.value = "grey50",
  guide = "colourbar",
  aesthetics = "colour",
  colors
)

scale_fill_gradientn(
  ...,
  colours,
  values = NULL,
  space = "Lab",
  na.value = "grey50",
  guide = "colourbar",
  aesthetics = "fill",
  colors
)
Arguments
| ... | Arguments passed on to scale_nameThe name of the scale that should be used for error messages associated with this scale. paletteA palette function that when called with a numeric vector with
values between 0 and 1 returns the corresponding output values
(e.g., nameThe name of the scale. Used as the axis or legend title. If
breaksOne of:
minor_breaksOne of:
n.breaksAn integer guiding the number of major breaks. The algorithm
may choose a slightly different number to ensure nice break labels. Will
only have an effect if labelsOne of:
limitsOne of:
rescalerA function used to scale the input values to the
range [0, 1]. This is always oobOne of:
transFor continuous scales, the name of a transformation object
or the object itself. Built-in transformations include "asn", "atanh",
"boxcox", "date", "exp", "hms", "identity", "log", "log10", "log1p", "log2",
"logit", "modulus", "probability", "probit", "pseudo_log", "reciprocal",
"reverse", "sqrt" and "time".A transformation object bundles together a transform, its inverse,
and methods for generating breaks and labels. Transformation objects
are defined in the scales package, and are called expandFor position scales, a vector of range expansion constants used to add some
padding around the data to ensure that they are placed some distance
away from the axes. Use the convenience function positionFor position scales, The position of the axis.
superThe super class to use for the constructed scale |
|---|---|
| low, high | Colours for low and high ends of the gradient. |
| space | colour space in which to calculate gradient. Must be "Lab" - other values are deprecated. |
| na.value | Colour to use for missing values |
| guide | Type of legend. Use |
| aesthetics | Character string or vector of character strings listing the
name(s) of the aesthetic(s) that this scale works with. This can be useful, for
example, to apply colour settings to the |
| mid | colour for mid point |
| midpoint | The midpoint (in data value) of the diverging scale. Defaults to 0. |
| colours, colors | Vector of colours to use for n-colour gradient. |
| values | if colours should not be evenly positioned along the gradient
this vector gives the position (between 0 and 1) for each colour in the
|
Details
Default colours are generated with munsell and
mnsl(c("2.5PB 2/4", "2.5PB 7/10")). Generally, for continuous
colour scales you want to keep hue constant, but vary chroma and
luminance. The munsell package makes this easy to do using the
Munsell colour system.
See also
scales::seq_gradient_pal() for details on underlying
palette
Other colour scales:
scale_alpha(),
scale_colour_brewer(),
scale_colour_grey(),
scale_colour_hue(),
scale_colour_steps(),
scale_colour_viridis_d()
Examples
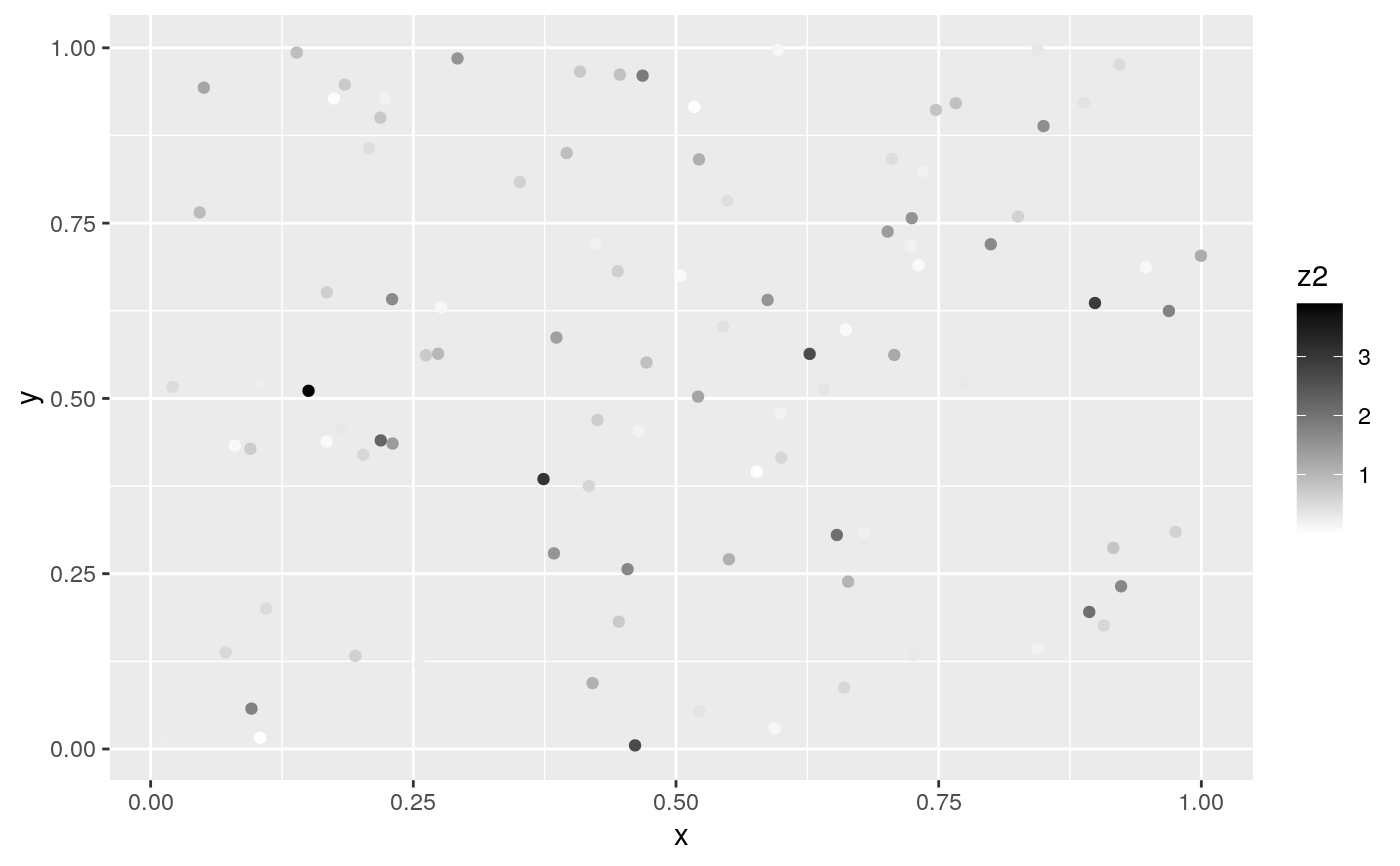
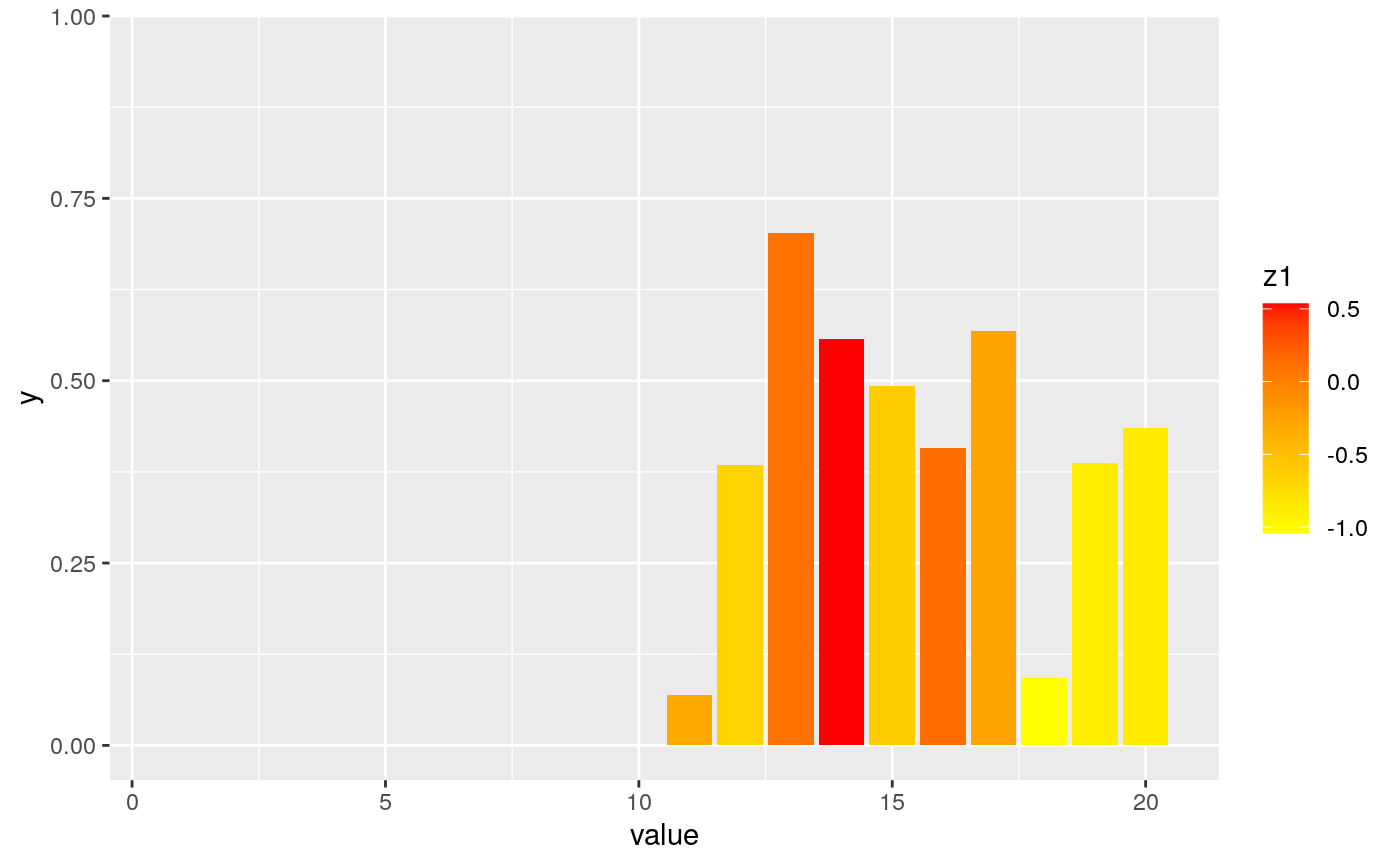
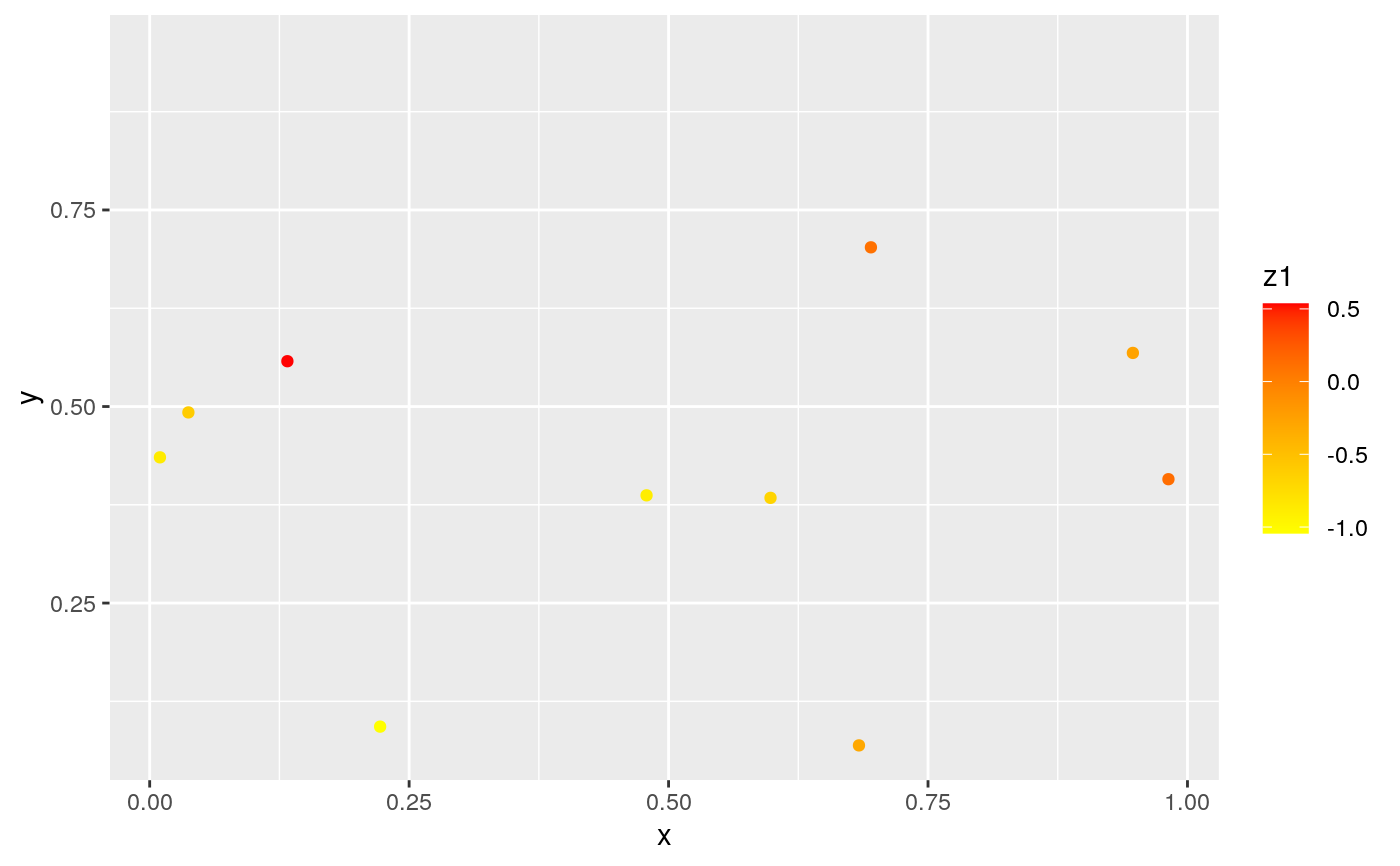
df <- data.frame( x = runif(100), y = runif(100), z1 = rnorm(100), z2 = abs(rnorm(100)) ) df_na <- data.frame( value = seq(1, 20), x = runif(20), y = runif(20), z1 = c(rep(NA, 10), rnorm(10)) ) # Default colour scale colours from light blue to dark blue ggplot(df, aes(x, y)) + geom_point(aes(colour = z2))# For diverging colour scales use gradient2 ggplot(df, aes(x, y)) + geom_point(aes(colour = z1)) + scale_colour_gradient2()# Use your own colour scale with gradientn ggplot(df, aes(x, y)) + geom_point(aes(colour = z1)) + scale_colour_gradientn(colours = terrain.colors(10))# Equivalent fill scales do the same job for the fill aesthetic ggplot(faithfuld, aes(waiting, eruptions)) + geom_raster(aes(fill = density)) + scale_fill_gradientn(colours = terrain.colors(10))# Adjust colour choices with low and high ggplot(df, aes(x, y)) + geom_point(aes(colour = z2)) + scale_colour_gradient(low = "white", high = "black")# Avoid red-green colour contrasts because ~10% of men have difficulty # seeing them # Use `na.value = NA` to hide missing values but keep the original axis range ggplot(df_na, aes(x = value, y)) + geom_bar(aes(fill = z1), stat = "identity") + scale_fill_gradient(low = "yellow", high = "red", na.value = NA)ggplot(df_na, aes(x, y)) + geom_point(aes(colour = z1)) + scale_colour_gradient(low = "yellow", high = "red", na.value = NA)#> Warning: Removed 10 rows containing missing values (geom_point).
