Benchmark plot creation time. Broken down into construct, build, render and draw times.
Source:R/bench.r
benchplot.RdBenchmark plot creation time. Broken down into construct, build, render and draw times.
benchplot(x)Arguments
- x
code to create ggplot2 plot
Examples
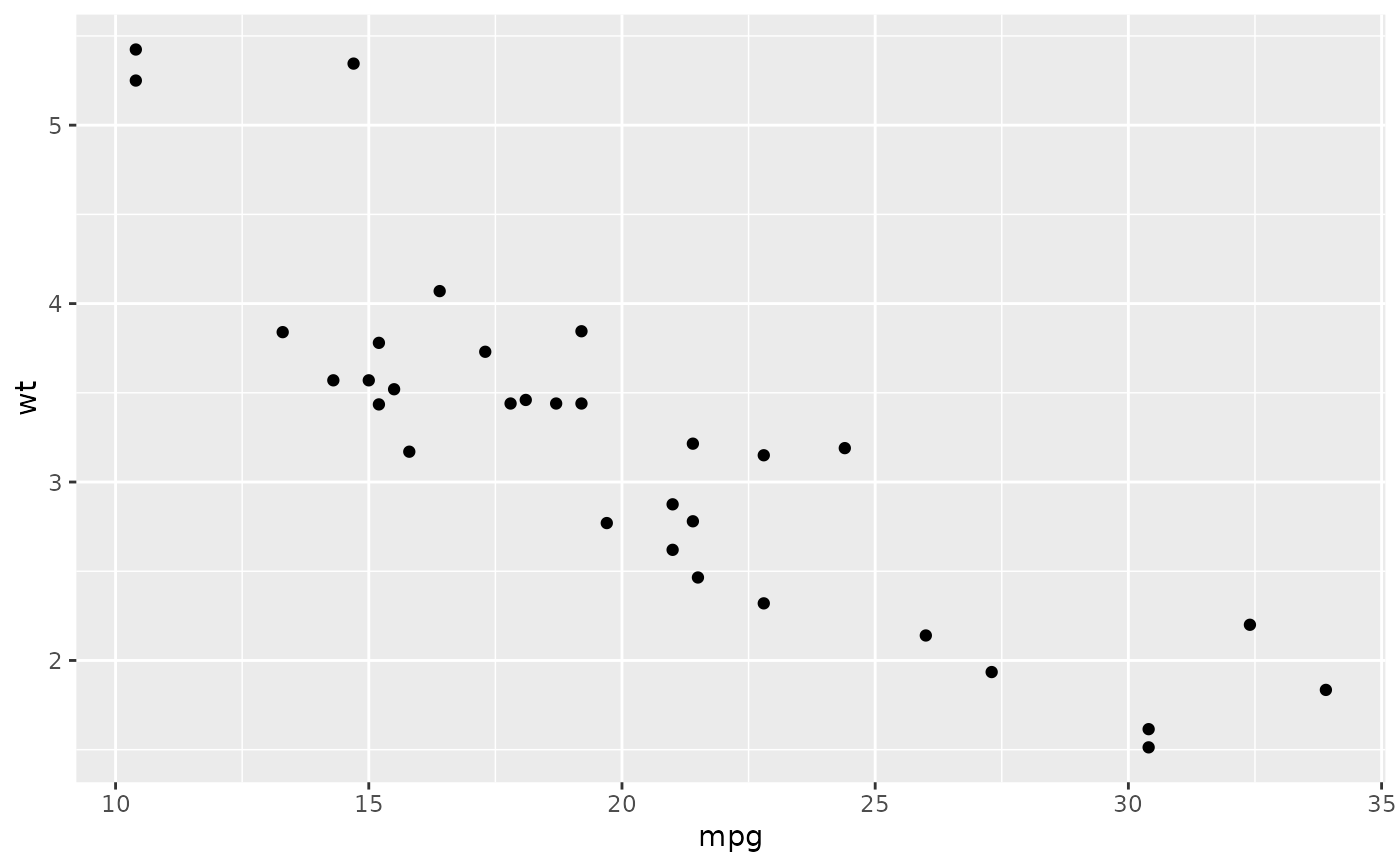
benchplot(ggplot(mtcars, aes(mpg, wt)) + geom_point())
#>        step user.self sys.self elapsed
#> 1 construct     0.003        0   0.003
#> 2     build     0.013        0   0.013
#> 3    render     0.019        0   0.018
#> 4      draw     0.028        0   0.027
#> 5     TOTAL     0.063        0   0.061
benchplot(ggplot(mtcars, aes(mpg, wt)) + geom_point() + facet_grid(. ~ cyl))
#>        step user.self sys.self elapsed
#> 1 construct     0.002        0   0.003
#> 2     build     0.026        0   0.027
#> 3    render     0.051        0   0.051
#> 4      draw     0.044        0   0.044
#> 5     TOTAL     0.123        0   0.125

# With tidy eval:
p <- expr(ggplot(mtcars, aes(mpg, wt)) + geom_point())
benchplot(!!p)

#>        step user.self sys.self elapsed
#> 1 construct     0.002        0   0.002
#> 2     build     0.012        0   0.012
#> 3    render     0.018        0   0.019
#> 4      draw     0.027        0   0.027
#> 5     TOTAL     0.059        0   0.060
#> step user.self sys.self elapsed
#> 1 construct 0.002 0 0.002
#> 2 build 0.012 0 0.012
#> 3 render 0.018 0 0.019
#> 4 draw 0.027 0 0.027
#> 5 TOTAL 0.059 0 0.060