This is a quick and dirty way to get map data (from the maps package) on to your plot. This is a good place to start if you need some crude reference lines, but you'll typically want something more sophisticated for communication graphics.
borders(
  database = "world",
  regions = ".",
  fill = NA,
  colour = "grey50",
  xlim = NULL,
  ylim = NULL,
  ...
)
Arguments
- database
map data, see
maps::map()for details- regions
map region
- fill
fill colour
- colour
border colour
- xlim, ylim
latitudinal and longitudinal ranges for extracting map polygons, see
maps::map()for details.- ...
Arguments passed on to
geom_polygonruleEither
"evenodd"or"winding". If polygons with holes are being drawn (using thesubgroupaesthetic) this argument defines how the hole coordinates are interpreted. See the examples ingrid::pathGrob()for an explanation.mappingSet of aesthetic mappings created by
aes()oraes_(). If specified andinherit.aes = TRUE(the default), it is combined with the default mapping at the top level of the plot. You must supplymappingif there is no plot mapping.dataThe data to be displayed in this layer. There are three options:
If
NULL, the default, the data is inherited from the plot data as specified in the call toggplot().A
data.frame, or other object, will override the plot data. All objects will be fortified to produce a data frame. Seefortify()for which variables will be created.A
functionwill be called with a single argument, the plot data. The return value must be adata.frame, and will be used as the layer data. Afunctioncan be created from aformula(e.g.~ head(.x, 10)).statThe statistical transformation to use on the data for this layer, as a string.
positionPosition adjustment, either as a string, or the result of a call to a position adjustment function.
show.legendlogical. Should this layer be included in the legends?
NA, the default, includes if any aesthetics are mapped.FALSEnever includes, andTRUEalways includes. It can also be a named logical vector to finely select the aesthetics to display.inherit.aesIf
FALSE, overrides the default aesthetics, rather than combining with them. This is most useful for helper functions that define both data and aesthetics and shouldn't inherit behaviour from the default plot specification, e.g.borders().na.rmIf
FALSE, the default, missing values are removed with a warning. IfTRUE, missing values are silently removed.
Examples
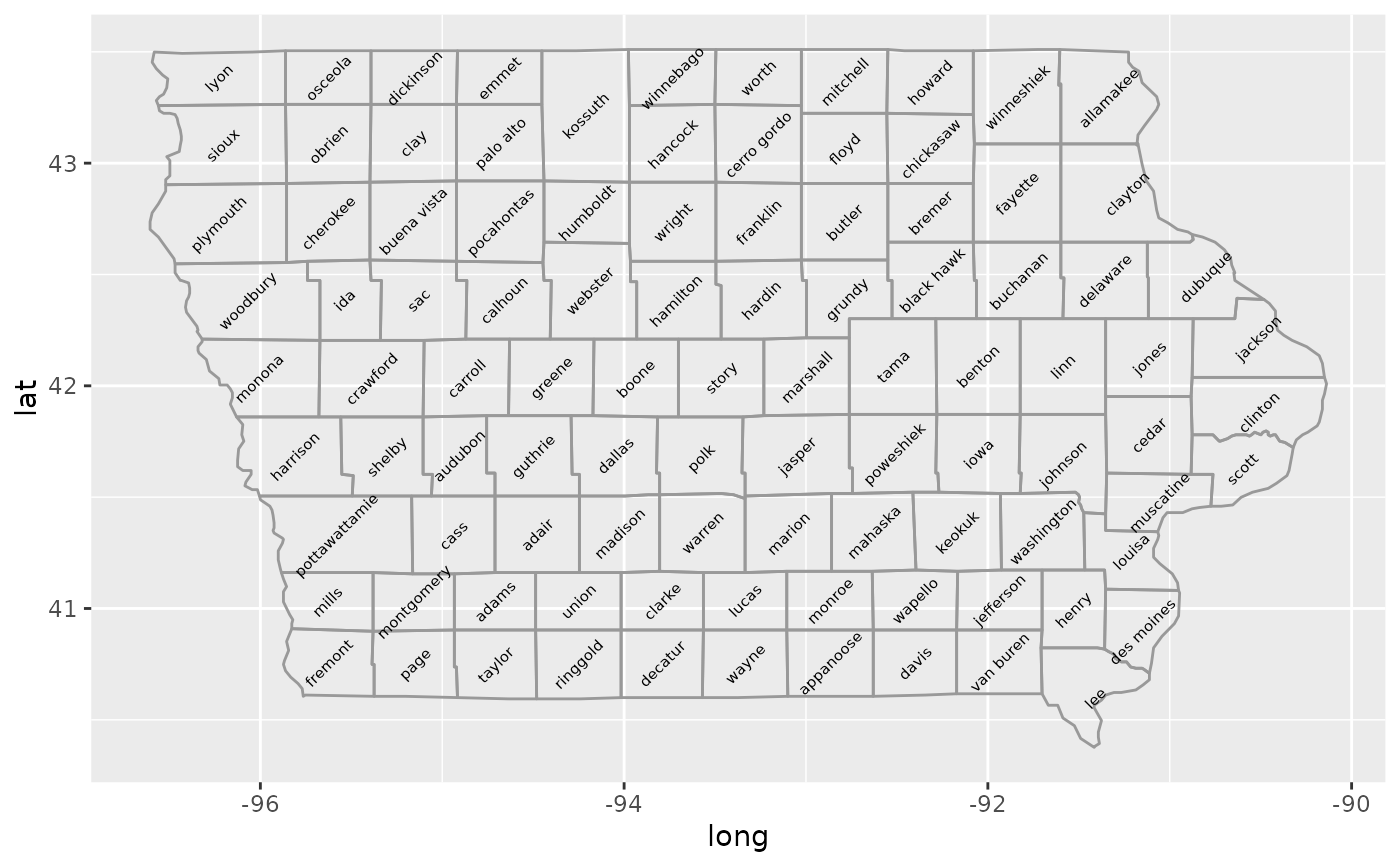
if (require("maps")) {
ia <- map_data("county", "iowa")
mid_range <- function(x) mean(range(x))
seats <- do.call(rbind, lapply(split(ia, ia$subregion), function(d) {
data.frame(lat = mid_range(d$lat), long = mid_range(d$long), subregion = unique(d$subregion))
}))
ggplot(ia, aes(long, lat)) +
geom_polygon(aes(group = group), fill = NA, colour = "grey60") +
geom_text(aes(label = subregion), data = seats, size = 2, angle = 45)
}
#> Loading required package: maps
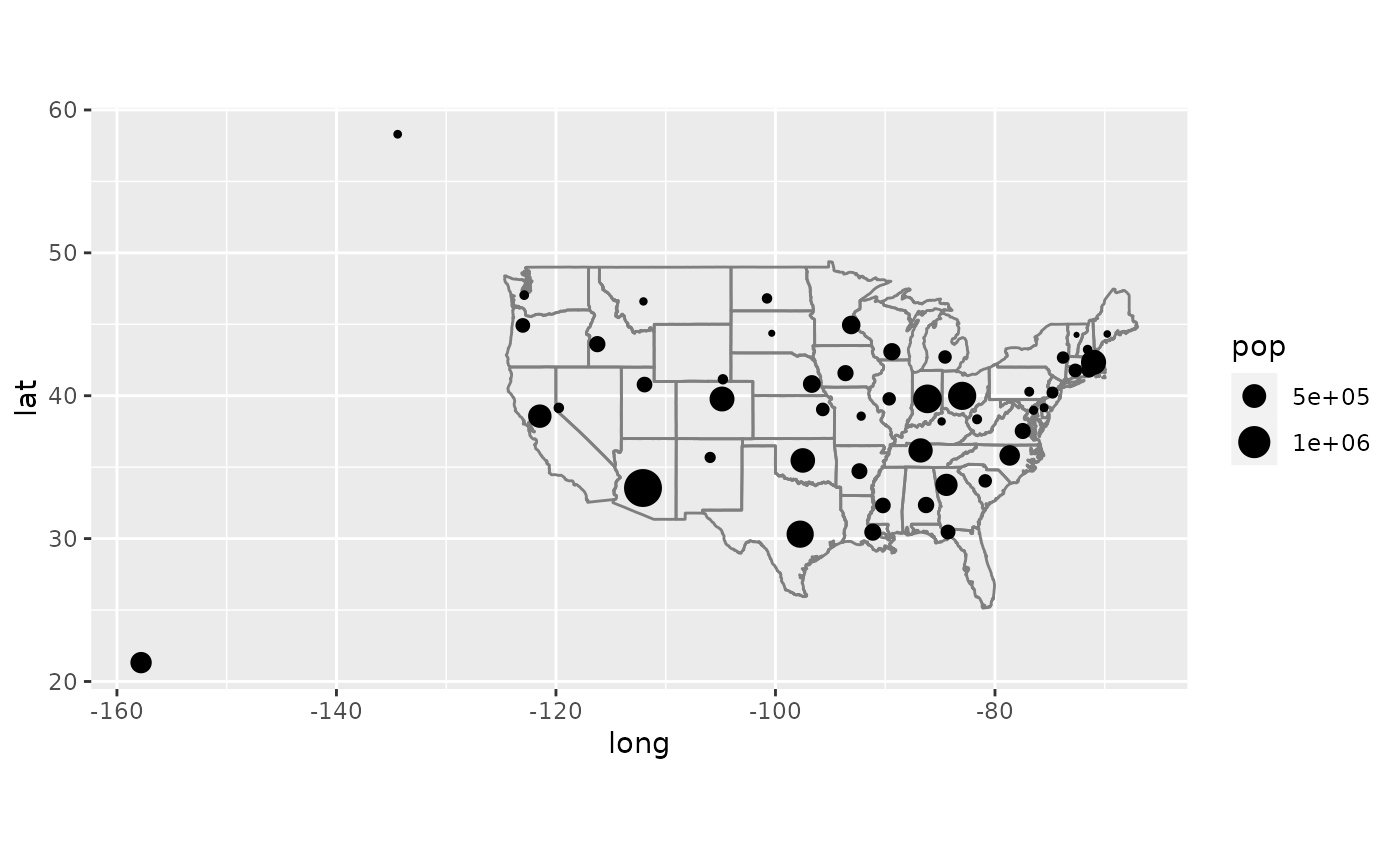
 if (require("maps")) {
data(us.cities)
capitals <- subset(us.cities, capital == 2)
ggplot(capitals, aes(long, lat)) +
borders("state") +
geom_point(aes(size = pop)) +
scale_size_area() +
coord_quickmap()
}
if (require("maps")) {
data(us.cities)
capitals <- subset(us.cities, capital == 2)
ggplot(capitals, aes(long, lat)) +
borders("state") +
geom_point(aes(size = pop)) +
scale_size_area() +
coord_quickmap()
}
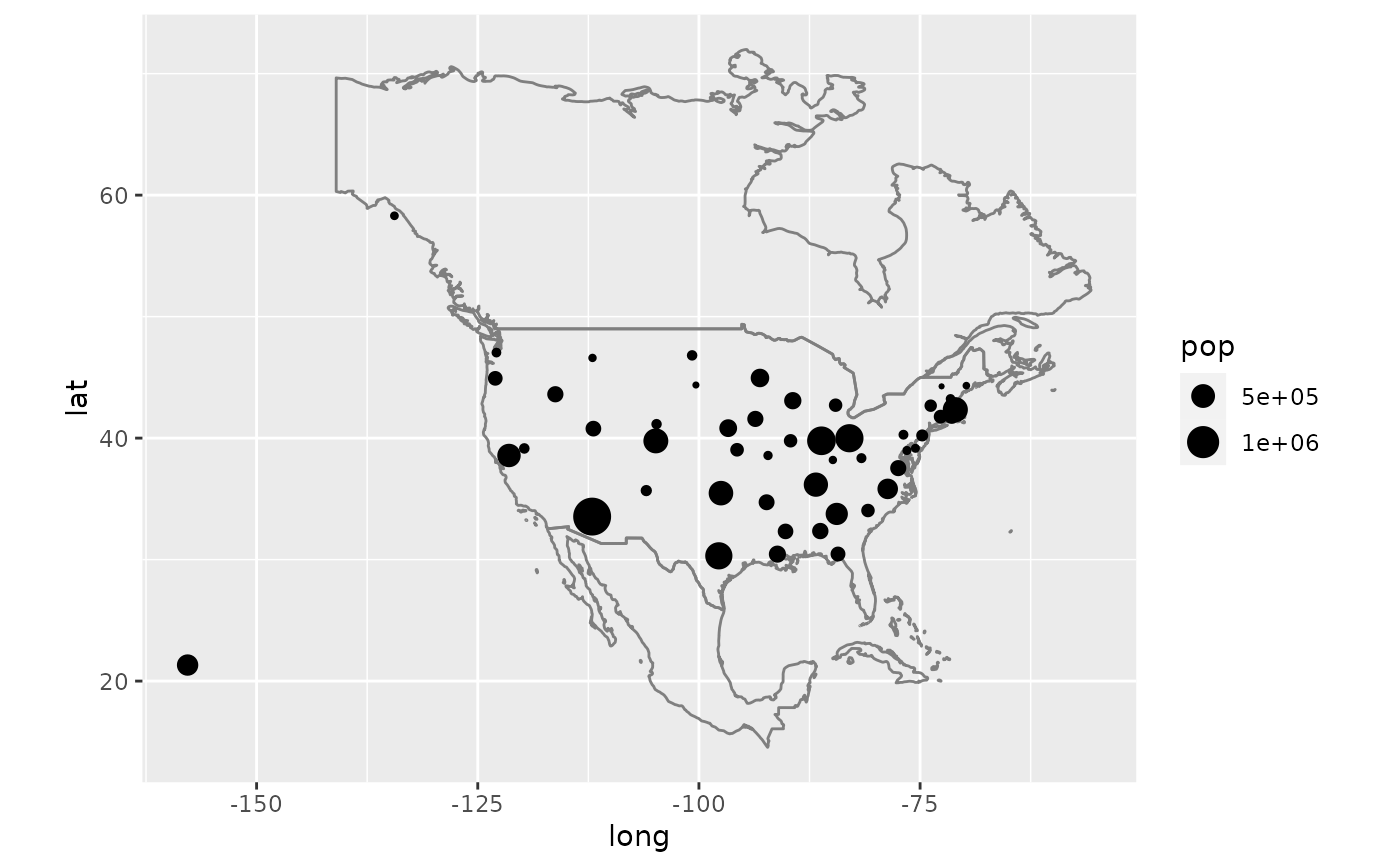
 if (require("maps")) {
# Same map, with some world context
ggplot(capitals, aes(long, lat)) +
borders("world", xlim = c(-130, -60), ylim = c(20, 50)) +
geom_point(aes(size = pop)) +
scale_size_area() +
coord_quickmap()
}
if (require("maps")) {
# Same map, with some world context
ggplot(capitals, aes(long, lat)) +
borders("world", xlim = c(-130, -60), ylim = c(20, 50)) +
geom_point(aes(size = pop)) +
scale_size_area() +
coord_quickmap()
}