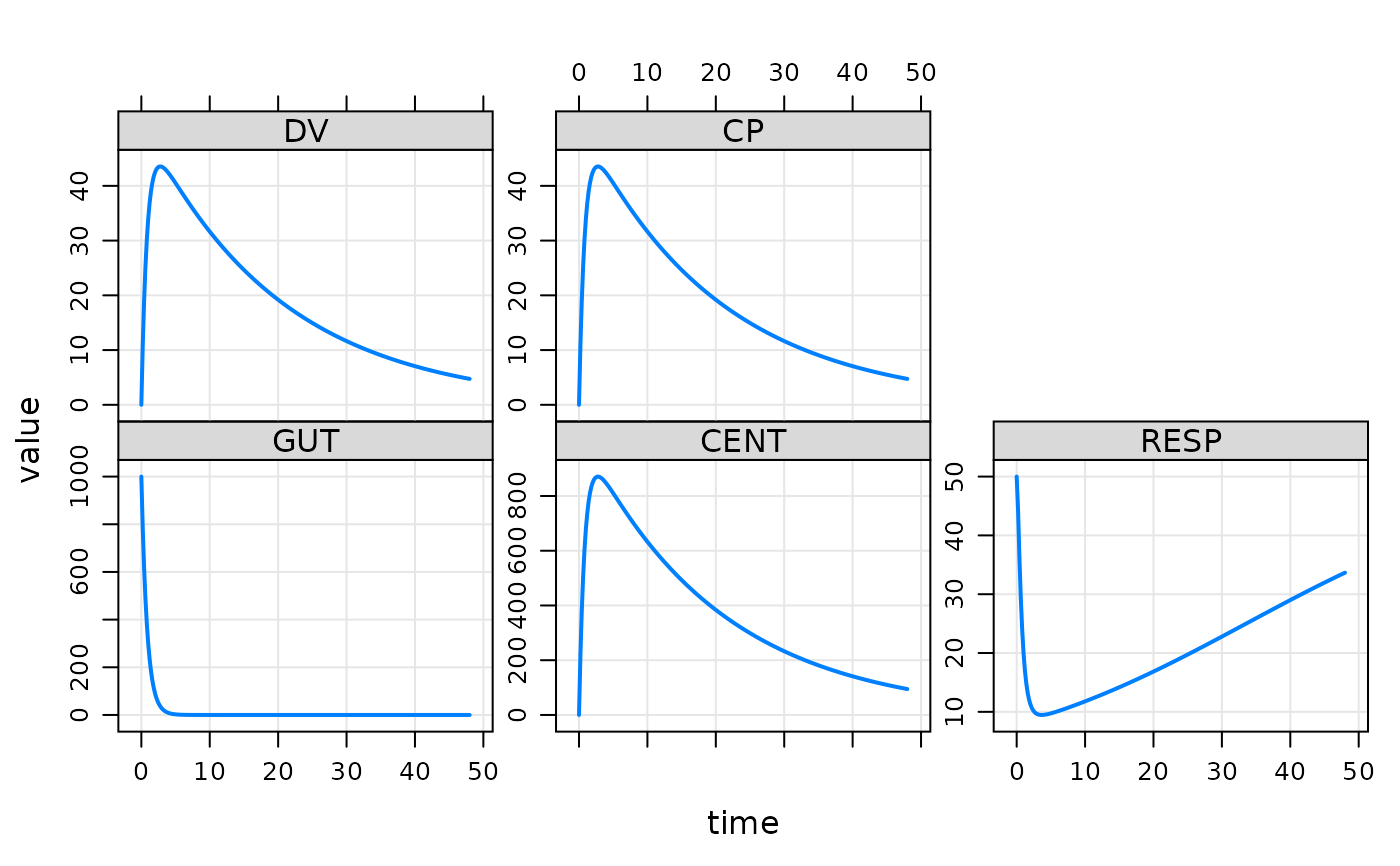
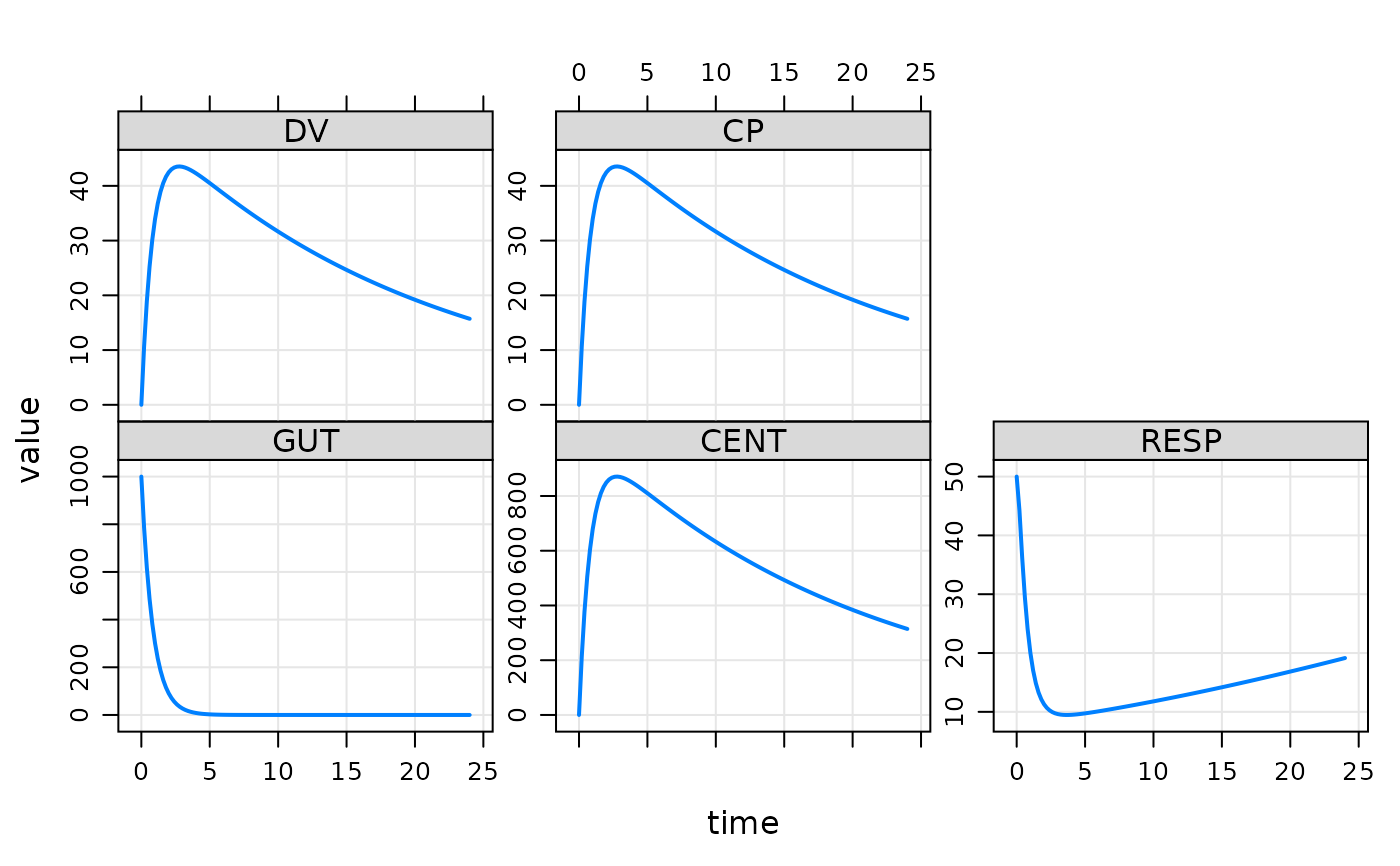
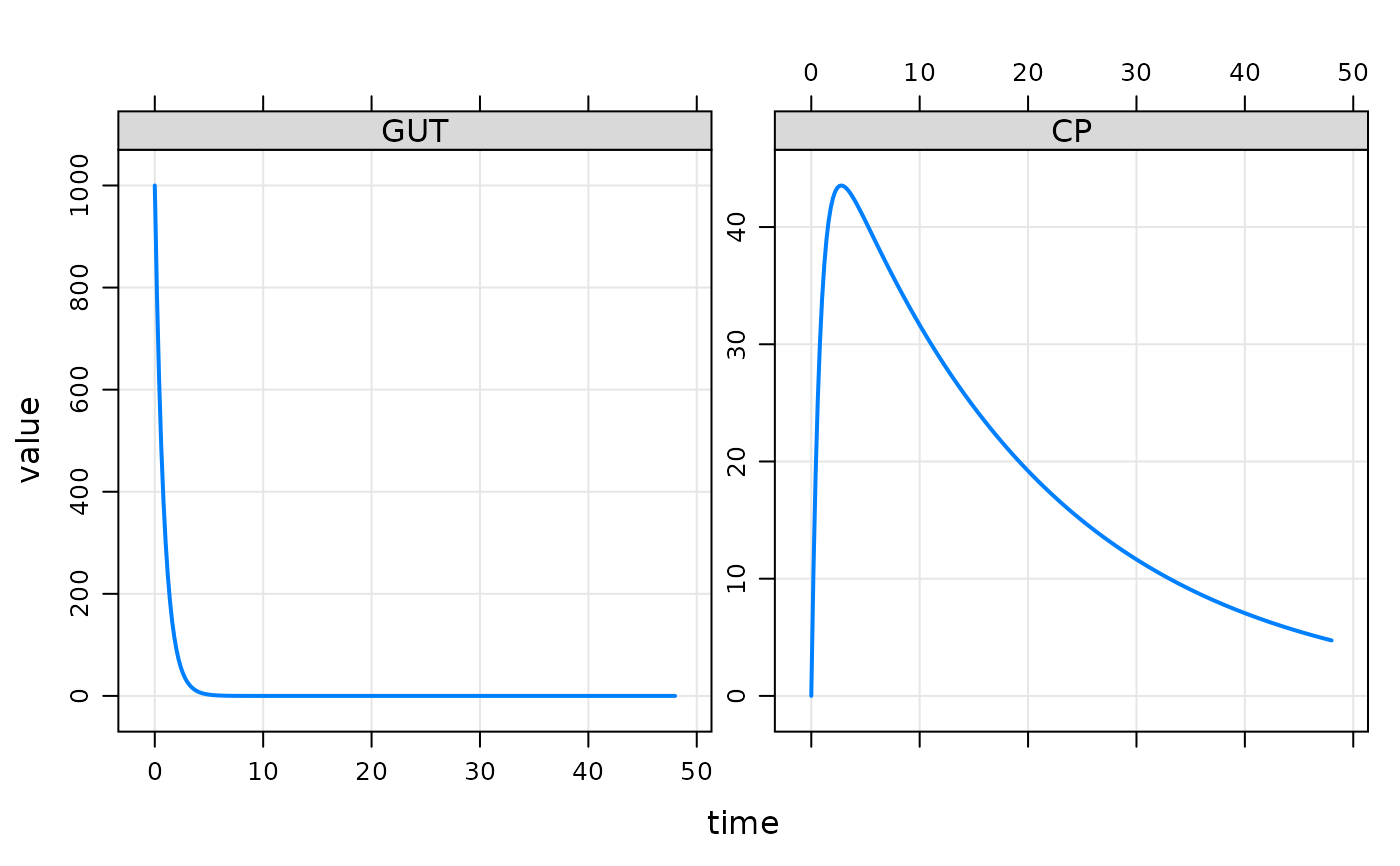
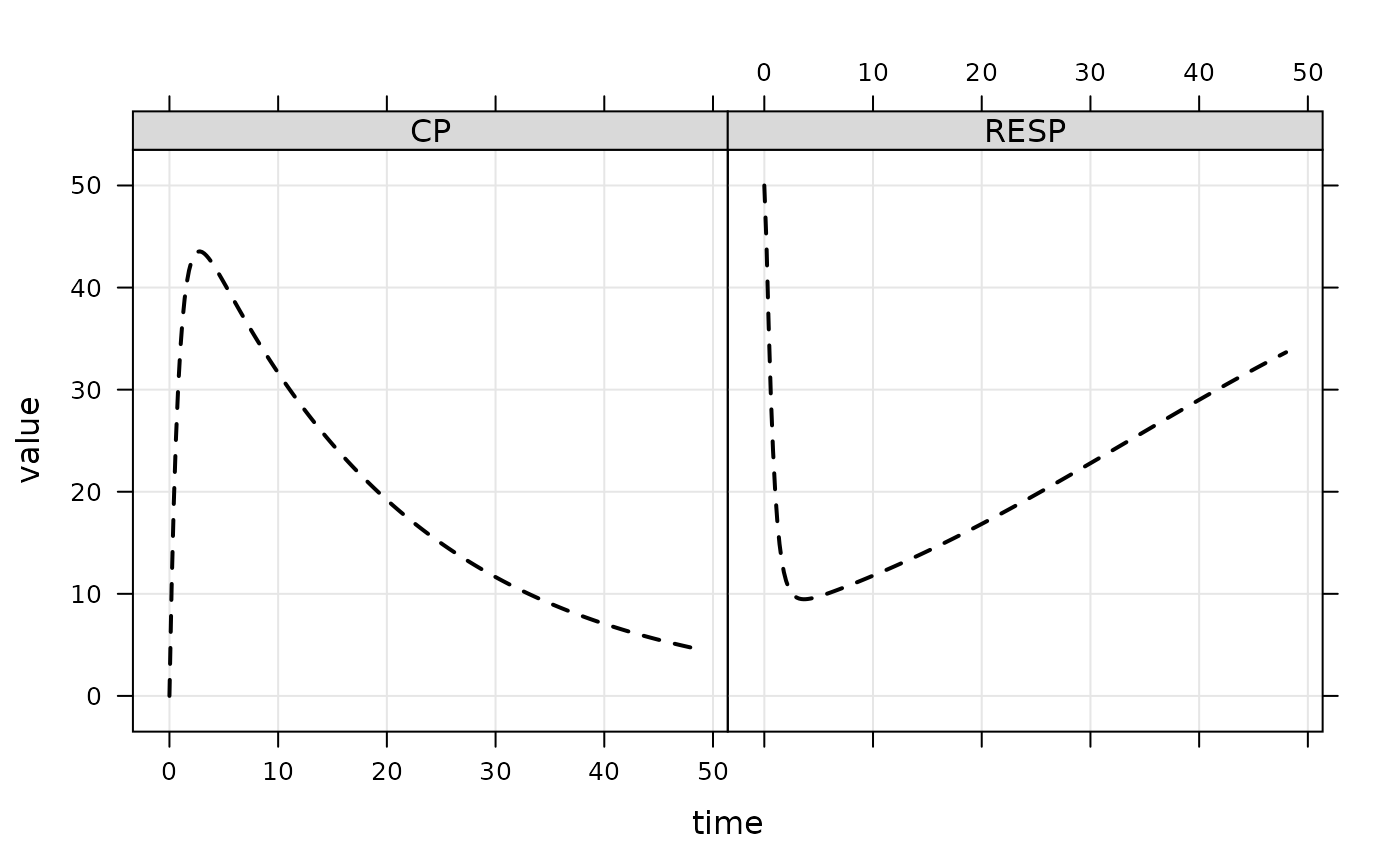
Generate a quick plot of simulated data
# S4 method for mrgsims,missing
plot(x, limit = 16, ...)

# S4 method for mrgsims,formula
plot(
  x,
  y,
  limit = 16,
  show.grid = TRUE,
  outer = TRUE,
  type = "l",
  lwd = 2,
  ylab = "value",
  groups = ID,
  scales = list(y = list(relation = "free")),
  logy = FALSE,
  logbr = 1,
  ...
)

# S4 method for mrgsims,character
plot(x, y, ...)
Arguments
| x | mrgsims object |
|---|---|
| limit | limit the the number of panels to create |
| ... | other arguments passed to xyplot |
| y | formula used for plotting |
| show.grid | logical indicating whether or not to draw panel.grid |
| outer | passed to xyplot |
| type | passed to xyplot |
| lwd | passed to xyplot |
| ylab | passed to xyplot |
| groups | passed to xyplot |
| scales | passed to xyplot |
| logy | plot the y variables on log scale |
| logbr | log scale breaks indicator; use |