Rotate axis text
rot_x(angle = 30, hjust = 1, vjust = NULL, vertical = FALSE, ...)

rot_y(angle = 30, hjust = 1, vjust = NULL, ...)
Arguments
- angle
passed to ggplot2::element_text
- hjust
passed to ggplot2::element_text
- vjust
passed to ggplot2::element_text
- vertical
if
TRUE, then x-axis tick labels are rotated 90 degrees withvjustset to 0.5 andhjustset to 0; whenverticalis set toTRUE, thenhjustcan be passed as character string that must match eithertop(thenhjustis set to 1) orbottom(thenhjustis set to 0- ...
passed to ggplot2::element_text
Details
If x-axis tick labels do not have enough space, consider using
vert = TRUE. By default, the tick labels will be justified up to the
x-axis line. Use hjust = "b" or hjust = "bottom" (with vert = TRUE)
to justify the axis labels toward the bottom margin of the plot.
Examples
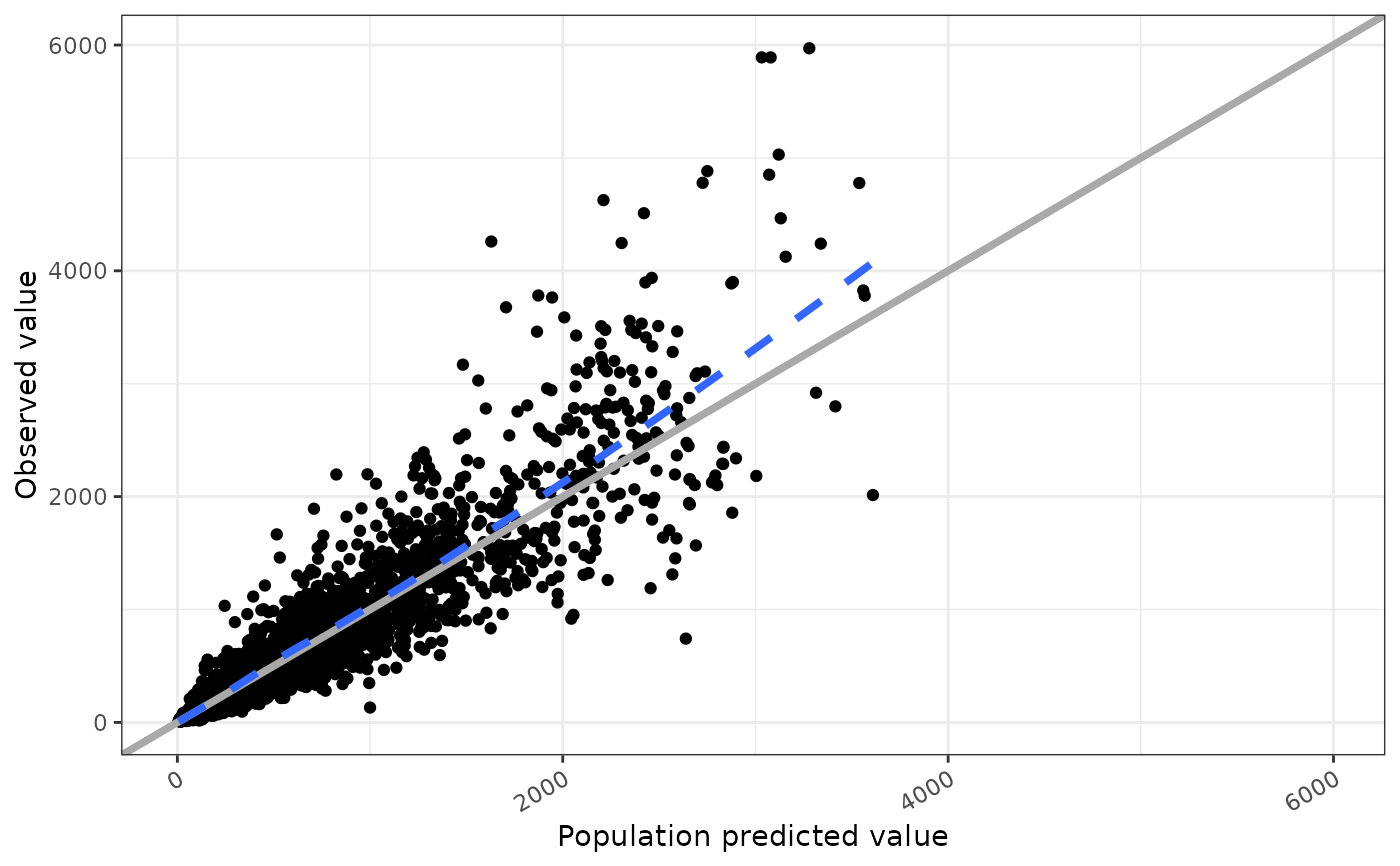
data <- pmplots_data_obs()

dv_pred(data) + rot_x()
#> `geom_smooth()` using formula 'y ~ x'


if (FALSE) {
cwres_cat(data, x = "CPc") + rot_x(vert = TRUE)
cwres_cat(data, x = "CPc") + rot_x(vert = TRUE, hjust = "b")
}
if (FALSE) {
cwres_cat(data, x = "CPc") + rot_x(vert = TRUE)
cwres_cat(data, x = "CPc") + rot_x(vert = TRUE, hjust = "b")
}