label_date() and label_time() label date/times using date/time format
strings. label_date_short() automatically constructs a short format string
sufficient to uniquely identify labels. It's inspired by matplotlib's
ConciseDateFormatter,
but uses a slightly different approach: ConciseDateFormatter formats
"firsts" (e.g. first day of month, first day of day) specially;
date_short() formats changes (e.g. new month, new year) specially.
label_date(format = "%Y-%m-%d", tz = "UTC", locale = NULL)

label_date_short(format = c("%Y", "%b", "%d", "%H:%M"), sep = "\n")

label_time(format = "%H:%M:%S", tz = "UTC", locale = NULL)
Arguments
- format
For
date_format()andtime_format()a date/time format string using standard POSIX specification. Seestrptime()for details.For
date_short()a character vector of length 4 giving the format components to use for year, month, day, and hour respectively.- tz
a time zone name, see
timezones(). Defaults to UTC- locale
Locale to use when for day and month names. The default uses the current locale. Setting this argument requires stringi, and you can see a complete list of supported locales with
stringi::stri_locale_list().- sep
Separator to use when combining date formats into a single string.
Value
All label_() functions return a "labelling" function, i.e. a function that
takes a vector x and returns a character vector of length(x) giving a
label for each input value.
Labelling functions are designed to be used with the labels argument of
ggplot2 scales. The examples demonstrate their use with x scales, but
they work similarly for all scales, including those that generate legends
rather than axes.
Examples
date_range <- function(start, days) {
start <- as.POSIXct(start)
c(start, start + days * 24 * 60 * 60)
}
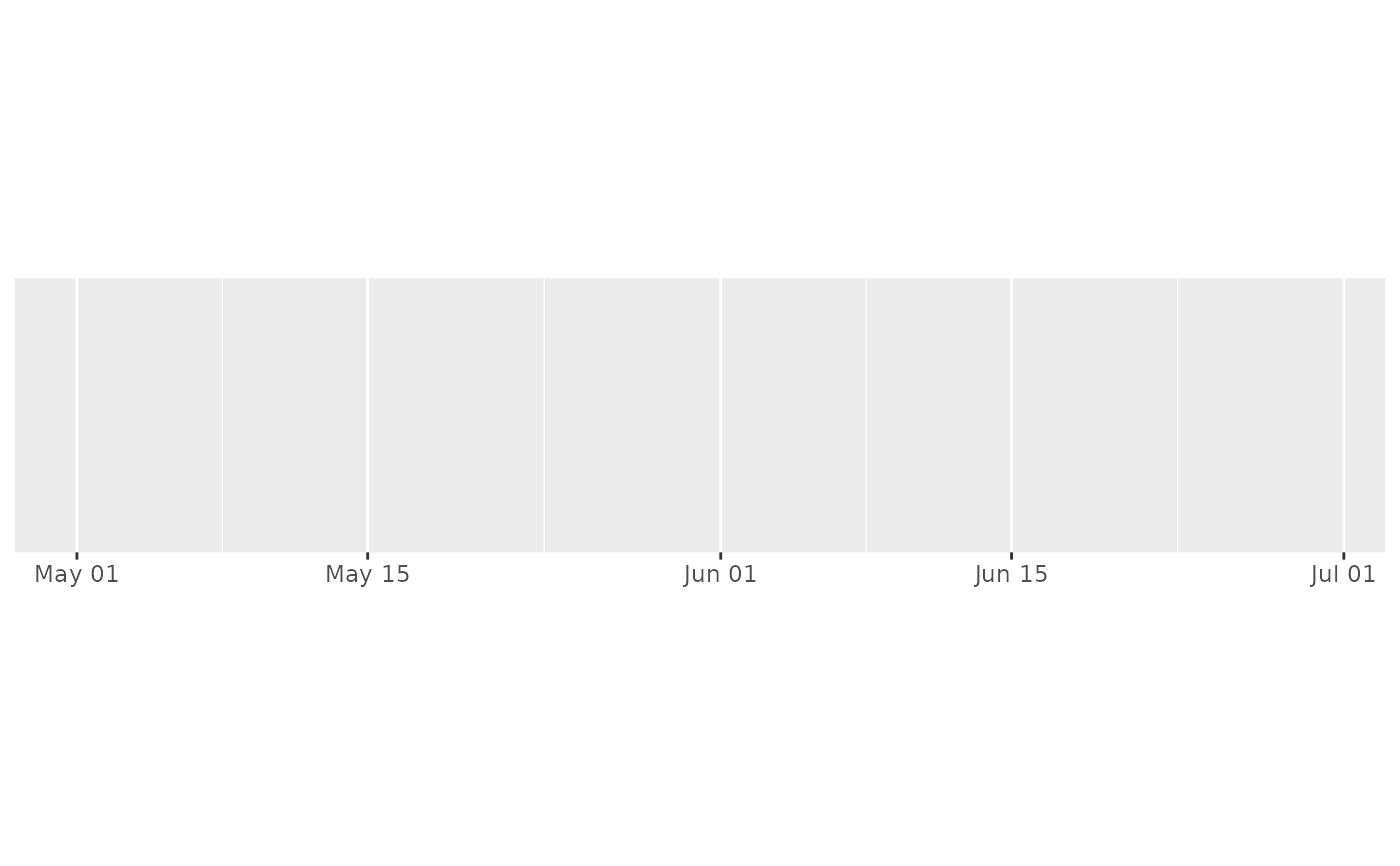
two_months <- date_range("2020-05-01", 60)
demo_datetime(two_months)
#> scale_x_datetime()
 demo_datetime(two_months, labels = date_format("%m/%d"))
#> scale_x_datetime(labels = date_format("%m/%d"))
demo_datetime(two_months, labels = date_format("%m/%d"))
#> scale_x_datetime(labels = date_format("%m/%d"))
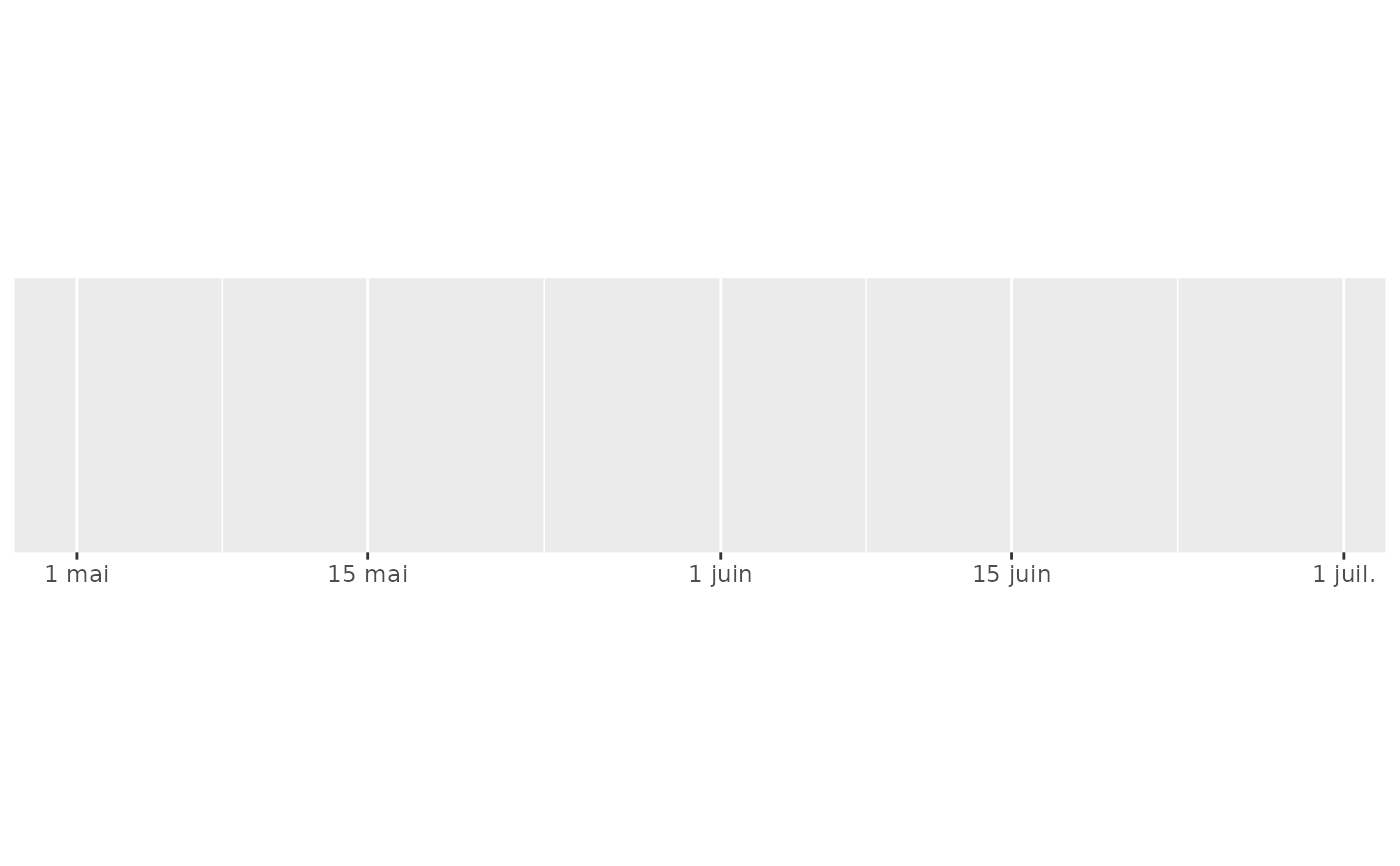
 demo_datetime(two_months, labels = date_format("%e %b", locale = "fr"))
#> scale_x_datetime(labels = date_format("%e %b", locale = "fr"))
demo_datetime(two_months, labels = date_format("%e %b", locale = "fr"))
#> scale_x_datetime(labels = date_format("%e %b", locale = "fr"))
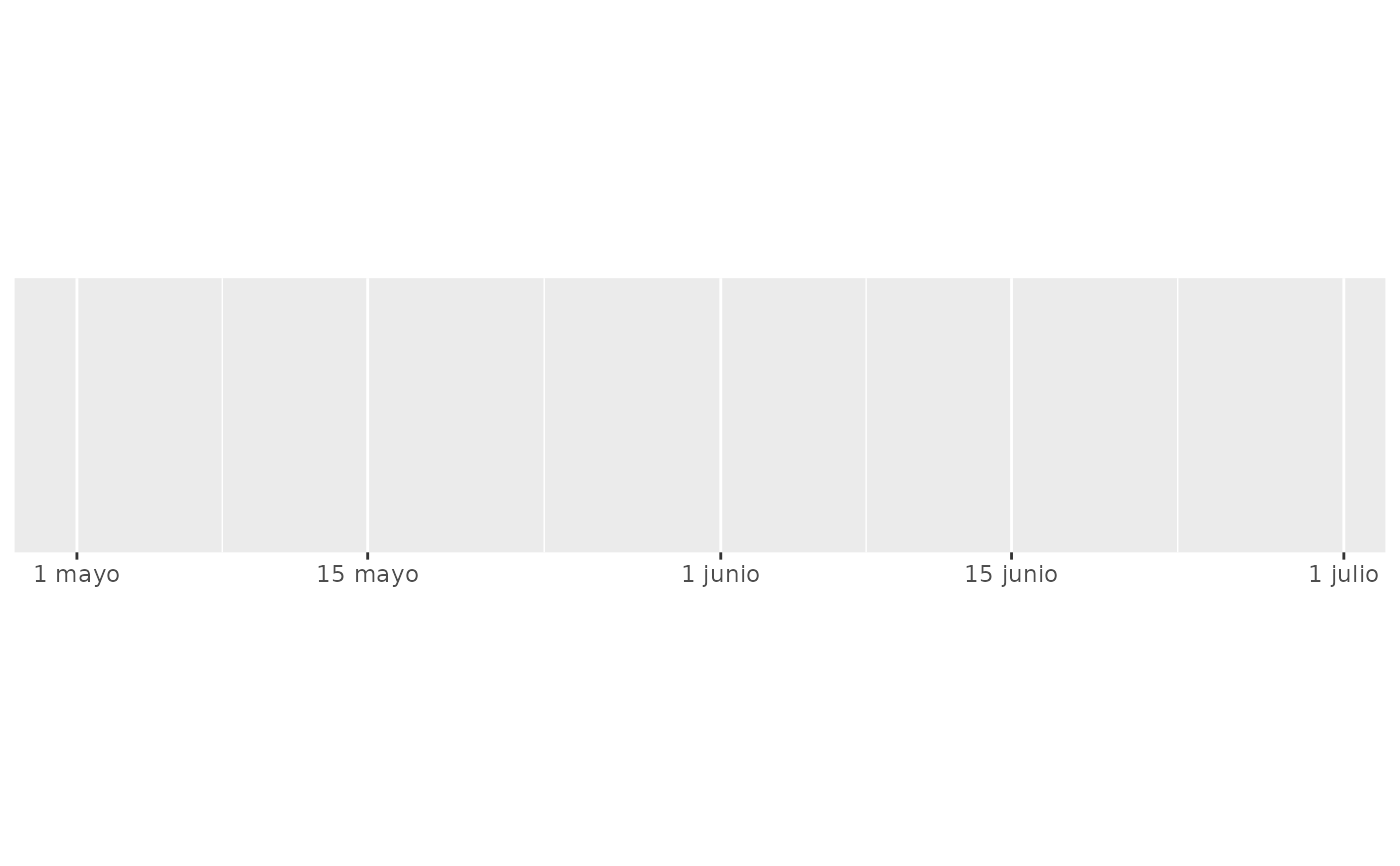
 demo_datetime(two_months, labels = date_format("%e %B", locale = "es"))
#> scale_x_datetime(labels = date_format("%e %B", locale = "es"))
demo_datetime(two_months, labels = date_format("%e %B", locale = "es"))
#> scale_x_datetime(labels = date_format("%e %B", locale = "es"))
 # ggplot2 provides a short-hand:
demo_datetime(two_months, date_labels = "%m/%d")
#> scale_x_datetime(date_labels = "%m/%d")
# ggplot2 provides a short-hand:
demo_datetime(two_months, date_labels = "%m/%d")
#> scale_x_datetime(date_labels = "%m/%d")
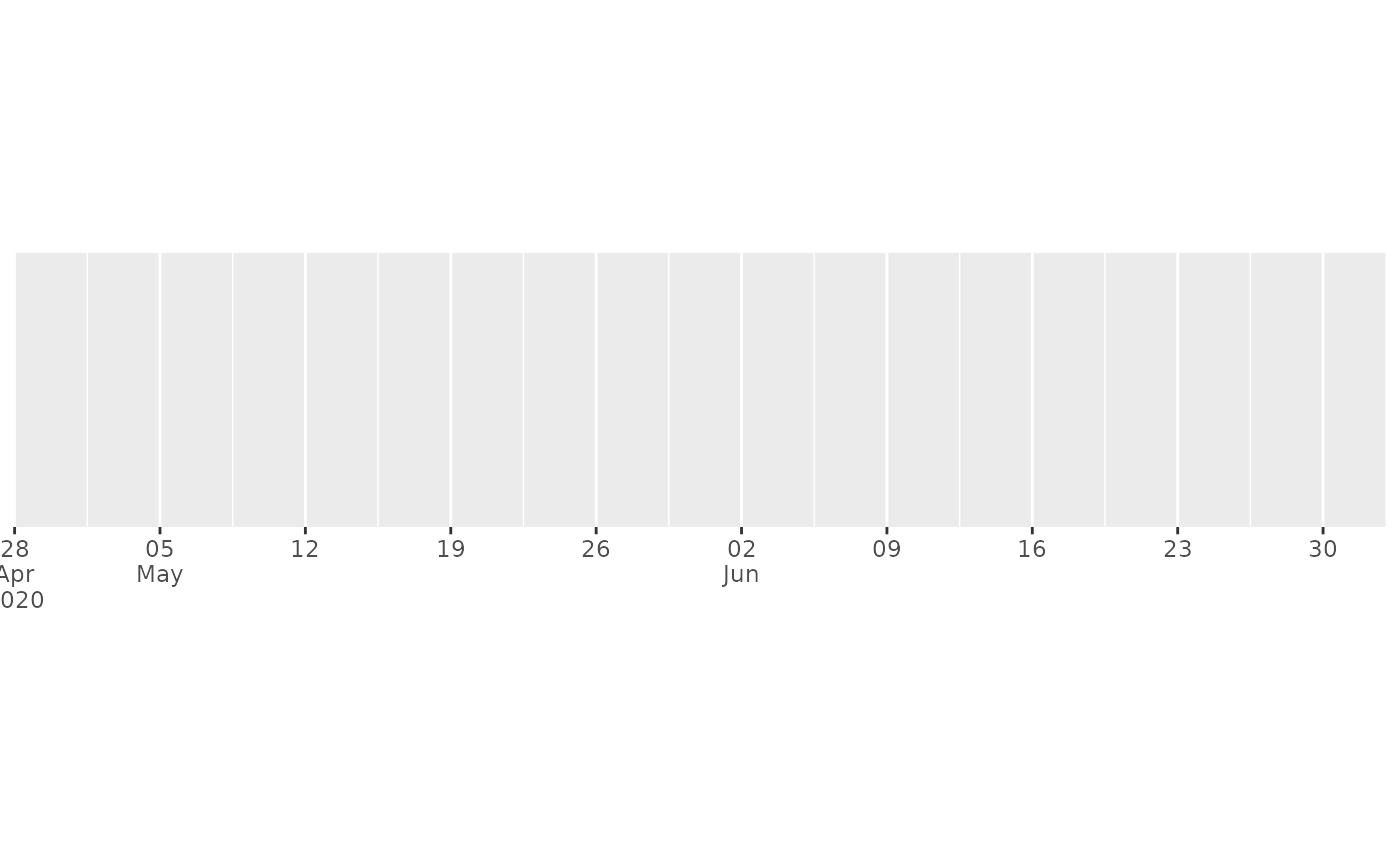
 # An alternative labelling system is label_date_short()
demo_datetime(two_months, date_breaks = "7 days", labels = label_date_short())
#> scale_x_datetime(date_breaks = "7 days", labels = label_date_short())
# An alternative labelling system is label_date_short()
demo_datetime(two_months, date_breaks = "7 days", labels = label_date_short())
#> scale_x_datetime(date_breaks = "7 days", labels = label_date_short())
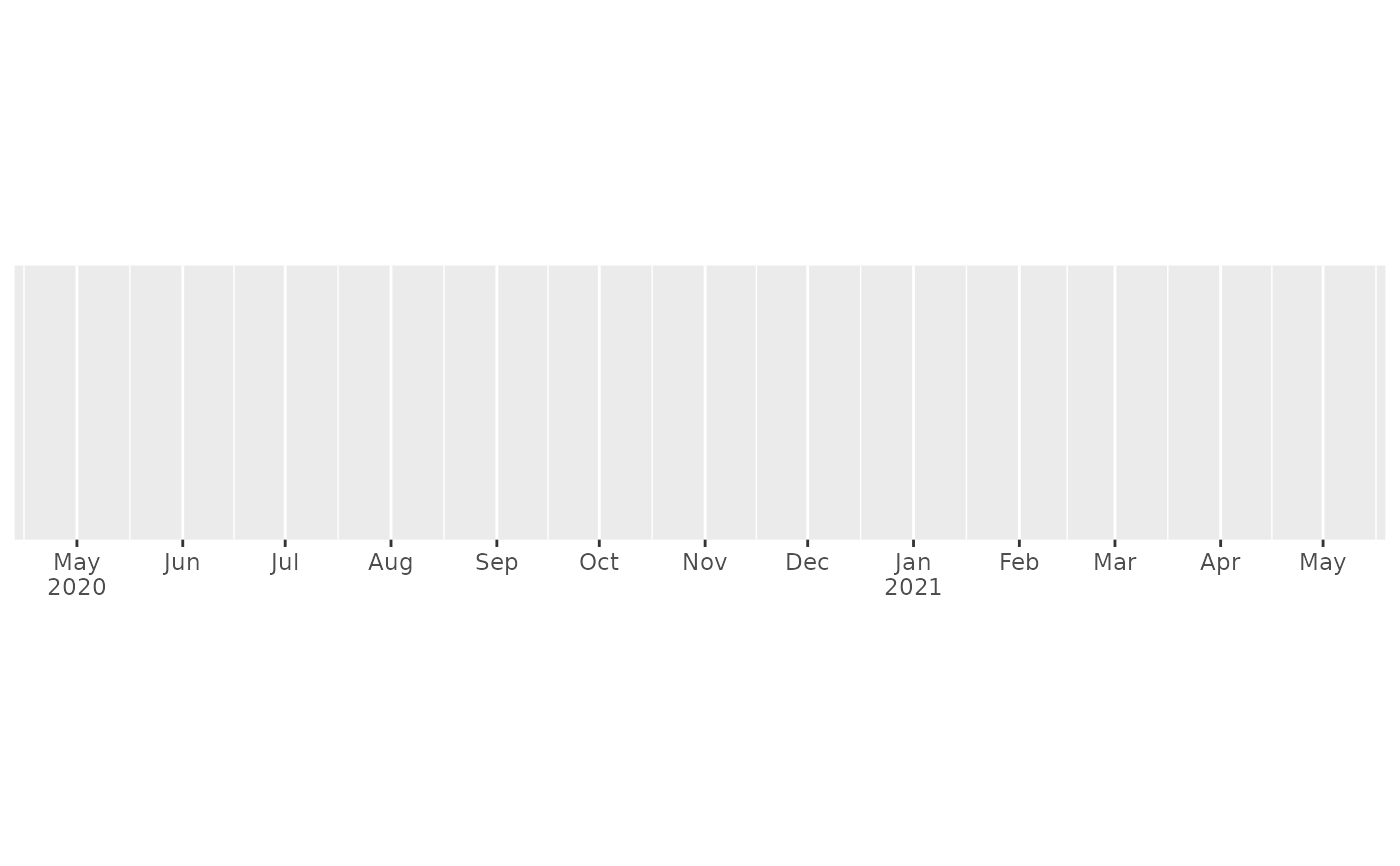
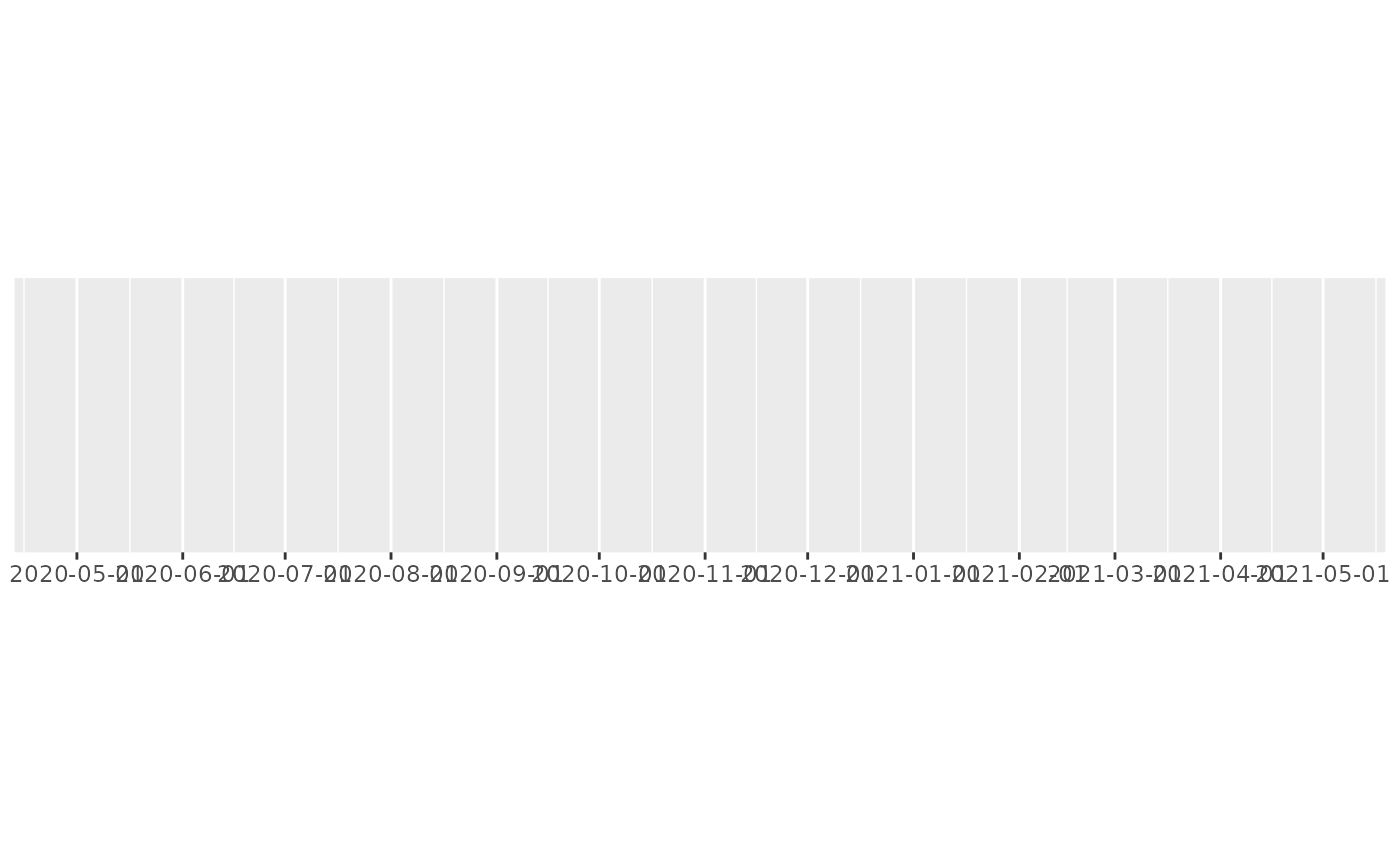
 # This is particularly effective for dense labels
one_year <- date_range("2020-05-01", 365)
demo_datetime(one_year, date_breaks = "month")
#> scale_x_datetime(date_breaks = "month")
# This is particularly effective for dense labels
one_year <- date_range("2020-05-01", 365)
demo_datetime(one_year, date_breaks = "month")
#> scale_x_datetime(date_breaks = "month")
 demo_datetime(one_year, date_breaks = "month", labels = label_date_short())
#> scale_x_datetime(date_breaks = "month", labels = label_date_short())
demo_datetime(one_year, date_breaks = "month", labels = label_date_short())
#> scale_x_datetime(date_breaks = "month", labels = label_date_short())