Tidy summarizes information about the components of a model. A model component might be a single term in a regression, a single hypothesis, a cluster, or a class. Exactly what tidy considers to be a model component varies across models but is usually self-evident. If a model has several distinct types of components, you will need to specify which components to return.
# S3 method for cch
tidy(x, conf.level = 0.95, ...)
Arguments
| x | An |
|---|---|
| conf.level | confidence level for CI |
| ... | Additional arguments. Not used. Needed to match generic
signature only. Cautionary note: Misspelled arguments will be
absorbed in |
See also
Other cch tidiers:
glance.cch(),
glance.survfit()
Other survival tidiers:
augment.coxph(),
augment.survreg(),
glance.aareg(),
glance.cch(),
glance.coxph(),
glance.pyears(),
glance.survdiff(),
glance.survexp(),
glance.survfit(),
glance.survreg(),
tidy.aareg(),
tidy.coxph(),
tidy.pyears(),
tidy.survdiff(),
tidy.survexp(),
tidy.survfit(),
tidy.survreg()
Value
A tibble::tibble() with columns:
Upper bound on the confidence interval for the estimate.
Lower bound on the confidence interval for the estimate.
The estimated value of the regression term.
The two-sided p-value associated with the observed statistic.
The value of a T-statistic to use in a hypothesis that the regression term is non-zero.
The standard error of the regression term.
The name of the regression term.
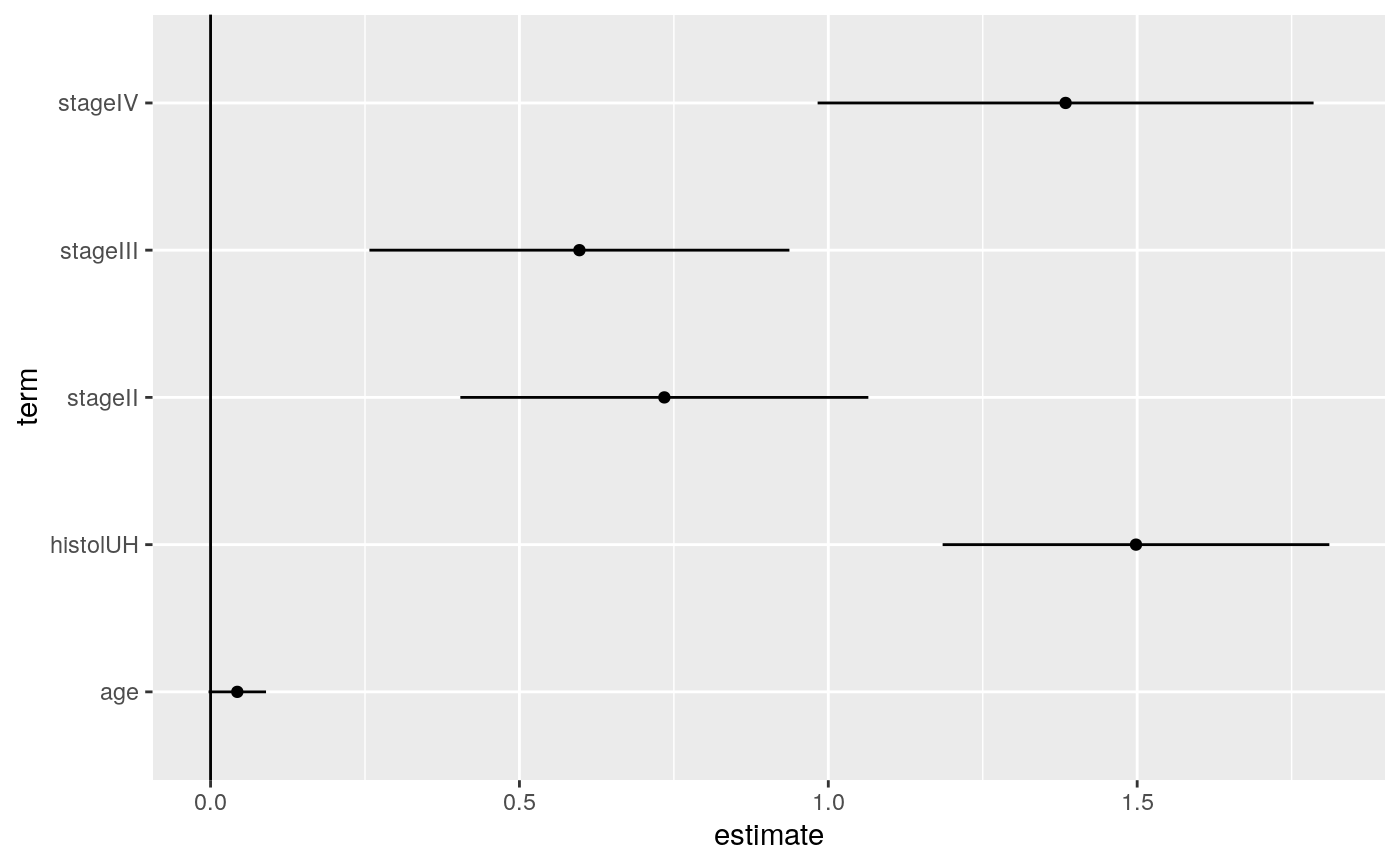
Examples
library(survival) # examples come from cch documentation subcoh <- nwtco$in.subcohort selccoh <- with(nwtco, rel == 1 | subcoh == 1) ccoh.data <- nwtco[selccoh, ] ccoh.data$subcohort <- subcoh[selccoh] ## central-lab histology ccoh.data$histol <- factor(ccoh.data$histol, labels = c("FH", "UH")) ## tumour stage ccoh.data$stage <- factor(ccoh.data$stage, labels = c("I", "II", "III", "IV")) ccoh.data$age <- ccoh.data$age / 12 # Age in years fit.ccP <- cch(Surv(edrel, rel) ~ stage + histol + age, data = ccoh.data, subcoh = ~subcohort, id = ~seqno, cohort.size = 4028 ) tidy(fit.ccP)#> # A tibble: 5 x 7 #> term estimate std.error statistic p.value conf.low conf.high #> <chr> <dbl> <dbl> <dbl> <dbl> <dbl> <dbl> #> 1 stageII 0.735 0.168 4.36 1.30e- 5 0.404 1.06 #> 2 stageIII 0.597 0.173 3.44 5.77e- 4 0.257 0.937 #> 3 stageIV 1.38 0.205 6.76 1.40e-11 0.983 1.79 #> 4 histolUH 1.50 0.160 9.38 0. 1.19 1.81 #> 5 age 0.0433 0.0237 1.82 6.83e- 2 -0.00324 0.0898# coefficient plot library(ggplot2) ggplot(tidy(fit.ccP), aes(x = estimate, y = term)) + geom_point() + geom_errorbarh(aes(xmin = conf.low, xmax = conf.high), height = 0) + geom_vline(xintercept = 0)