Tidy summarizes information about the components of a model. A model component might be a single term in a regression, a single hypothesis, a cluster, or a class. Exactly what tidy considers to be a model component varies across models but is usually self-evident. If a model has several distinct types of components, you will need to specify which components to return.
# S3 method for spec
tidy(x, ...)
Arguments
- x
A
specobject created bystats::spectrum().- ...
Additional arguments. Not used. Needed to match generic signature only. Cautionary note: Misspelled arguments will be absorbed in
..., where they will be ignored. If the misspelled argument has a default value, the default value will be used. For example, if you passconf.lvel = 0.9, all computation will proceed usingconf.level = 0.95. Additionally, if you passnewdata = my_tibbleto anaugment()method that does not accept anewdataargument, it will use the default value for thedataargument.
Value
A tibble::tibble() with columns:
- freq
Vector of frequencies at which the spectral density is estimated.
- spec
Vector (for univariate series) or matrix (for multivariate series) of estimates of the spectral density at frequencies corresponding to freq.
Examples
spc <- spectrum(lh)
 tidy(spc)
#> # A tibble: 24 × 2
#> freq spec
#> <dbl> <dbl>
#> 1 0.0208 0.0912
#> 2 0.0417 0.331
#> 3 0.0625 0.836
#> 4 0.0833 1.17
#> 5 0.104 0.350
#> 6 0.125 1.51
#> 7 0.146 0.328
#> 8 0.167 0.618
#> 9 0.188 0.320
#> 10 0.208 0.0675
#> # … with 14 more rows
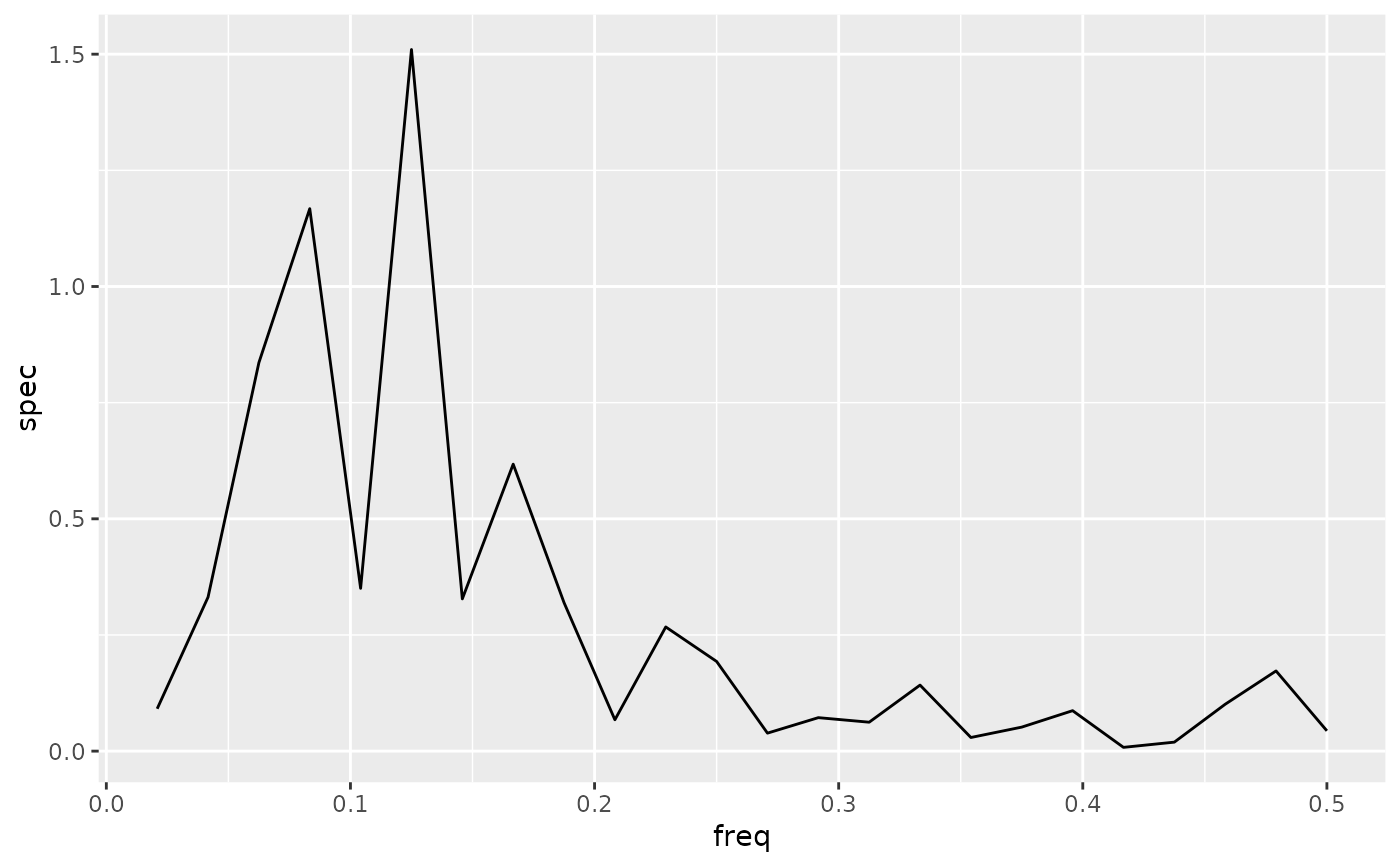
library(ggplot2)
ggplot(tidy(spc), aes(freq, spec)) +
geom_line()
tidy(spc)
#> # A tibble: 24 × 2
#> freq spec
#> <dbl> <dbl>
#> 1 0.0208 0.0912
#> 2 0.0417 0.331
#> 3 0.0625 0.836
#> 4 0.0833 1.17
#> 5 0.104 0.350
#> 6 0.125 1.51
#> 7 0.146 0.328
#> 8 0.167 0.618
#> 9 0.188 0.320
#> 10 0.208 0.0675
#> # … with 14 more rows
library(ggplot2)
ggplot(tidy(spc), aes(freq, spec)) +
geom_line()