Tidy summarizes information about the components of a model. A model component might be a single term in a regression, a single hypothesis, a cluster, or a class. Exactly what tidy considers to be a model component varies across models but is usually self-evident. If a model has several distinct types of components, you will need to specify which components to return.
# S3 method for zoo
tidy(x, ...)
Arguments
- x
A
zooobject such as those created byzoo::zoo().- ...
Additional arguments. Not used. Needed to match generic signature only. Cautionary note: Misspelled arguments will be absorbed in
..., where they will be ignored. If the misspelled argument has a default value, the default value will be used. For example, if you passconf.lvel = 0.9, all computation will proceed usingconf.level = 0.95. Additionally, if you passnewdata = my_tibbleto anaugment()method that does not accept anewdataargument, it will use the default value for thedataargument.
Value
A tibble::tibble() with columns:
- index
Index (i.e. date or time) for a `ts` or `zoo` object.
- series
Name of the series (present only for multivariate time series).
- value
The value/estimate of the component. Results from data reshaping.
Examples
# feel free to ignore the following line—it allows {broom} to supply
# examples without requiring the model-supplying package to be installed.
if (requireNamespace("zoo", quietly = TRUE)) {
# load libraries for models and data
library(zoo)
library(ggplot2)
set.seed(1071)
# generate data
Z.index <- as.Date(sample(12450:12500, 10))
Z.data <- matrix(rnorm(30), ncol = 3)
colnames(Z.data) <- c("Aa", "Bb", "Cc")
Z <- zoo(Z.data, Z.index)
# summarize model fit with tidiers + visualization
tidy(Z)
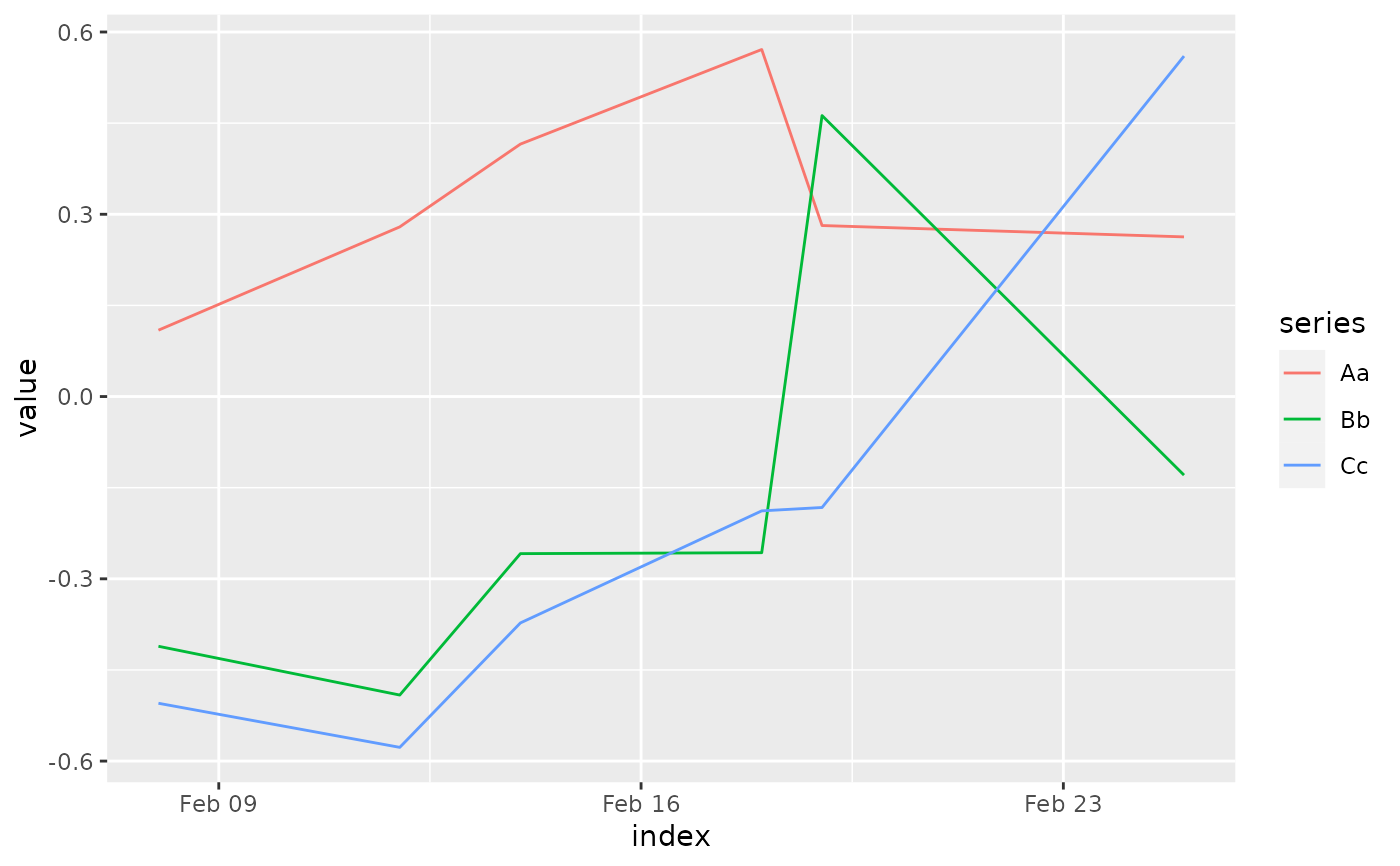
ggplot(tidy(Z), aes(index, value, color = series)) +
geom_line()
ggplot(tidy(Z), aes(index, value)) +
geom_line() +
facet_wrap(~series, ncol = 1)
Zrolled <- rollmean(Z, 5)
ggplot(tidy(Zrolled), aes(index, value, color = series)) +
geom_line()
}