Vertical intervals: lines, crossbars & errorbars
Source:R/geom-crossbar.r, R/geom-errorbar.r, R/geom-linerange.r, and 2 more
geom_linerange.RdVarious ways of representing a vertical interval defined by x,
ymin and ymax. Each case draws a single graphical object.
geom_crossbar(mapping = NULL, data = NULL, stat = "identity",
  position = "identity", ..., fatten = 2.5, na.rm = FALSE,
  show.legend = NA, inherit.aes = TRUE)

geom_errorbar(mapping = NULL, data = NULL, stat = "identity",
  position = "identity", ..., na.rm = FALSE, show.legend = NA,
  inherit.aes = TRUE)

geom_linerange(mapping = NULL, data = NULL, stat = "identity",
  position = "identity", ..., na.rm = FALSE, show.legend = NA,
  inherit.aes = TRUE)

geom_pointrange(mapping = NULL, data = NULL, stat = "identity",
  position = "identity", ..., fatten = 4, na.rm = FALSE,
  show.legend = NA, inherit.aes = TRUE)
Arguments
| mapping | Set of aesthetic mappings created by |
|---|---|
| data | The data to be displayed in this layer. There are three options: If A A |
| stat | The statistical transformation to use on the data for this layer, as a string. |
| position | Position adjustment, either as a string, or the result of a call to a position adjustment function. |
| ... | Other arguments passed on to |
| fatten | A multiplicative factor used to increase the size of the
middle bar in |
| na.rm | If |
| show.legend | logical. Should this layer be included in the legends?
|
| inherit.aes | If |
Aesthetics
geom_linerange() understands the following aesthetics (required aesthetics are in bold):
xyminymaxalphacolourgrouplinetypesize
Learn more about setting these aesthetics in vignette("ggplot2-specs").
See also
stat_summary() for examples of these guys in use,
geom_smooth() for continuous analogue,
geom_errorbarh() for a horizontal error bar.
Examples
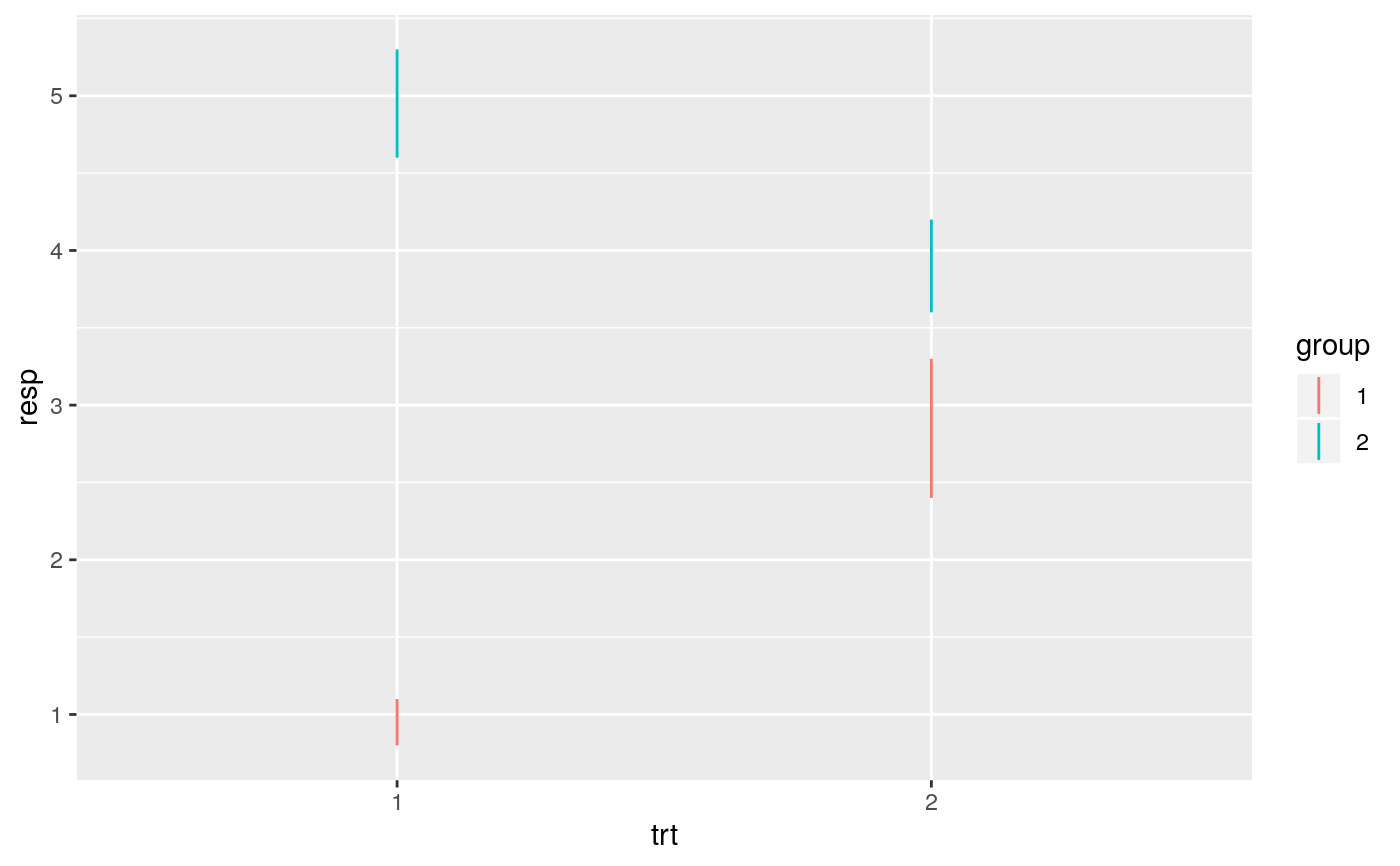
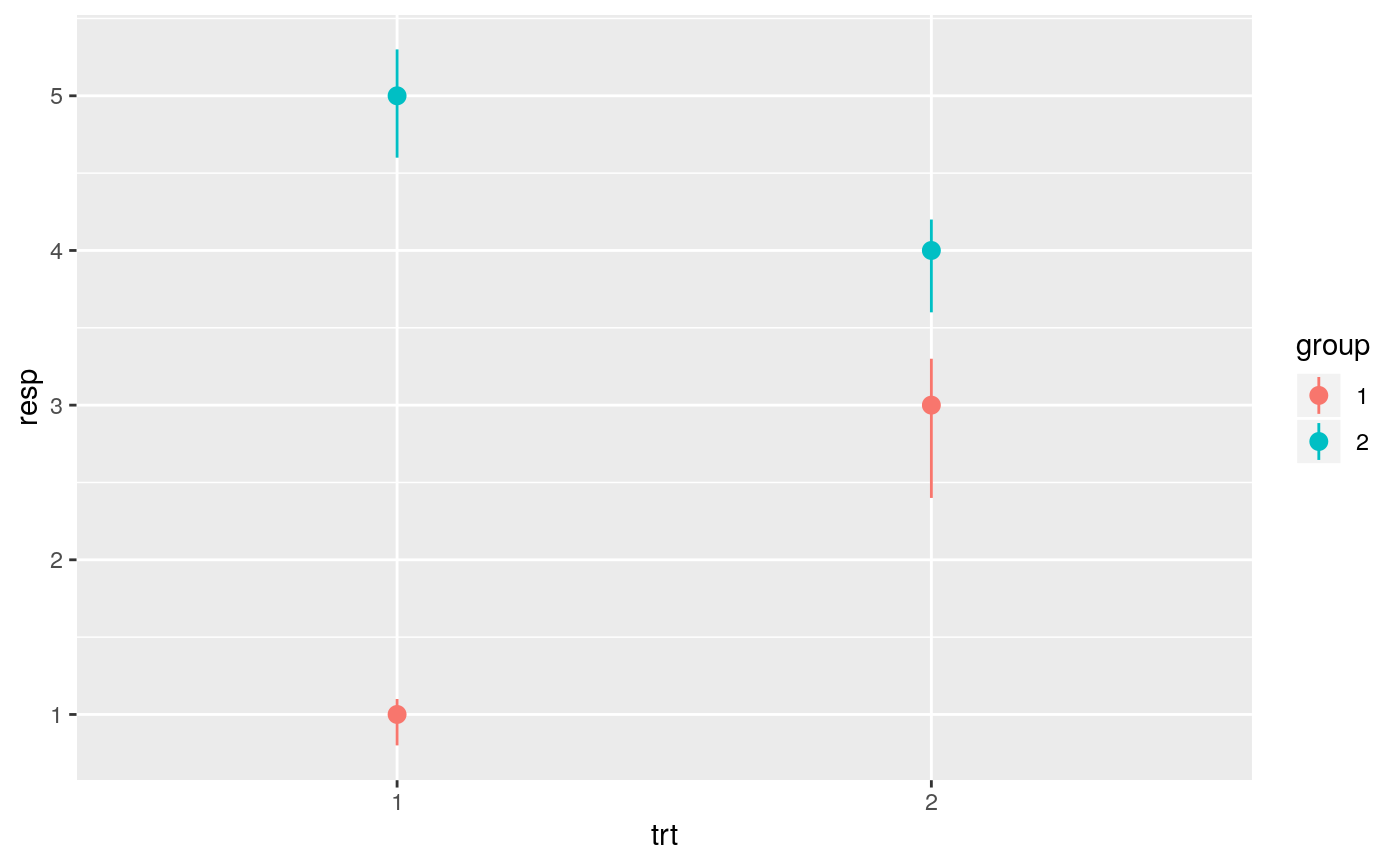
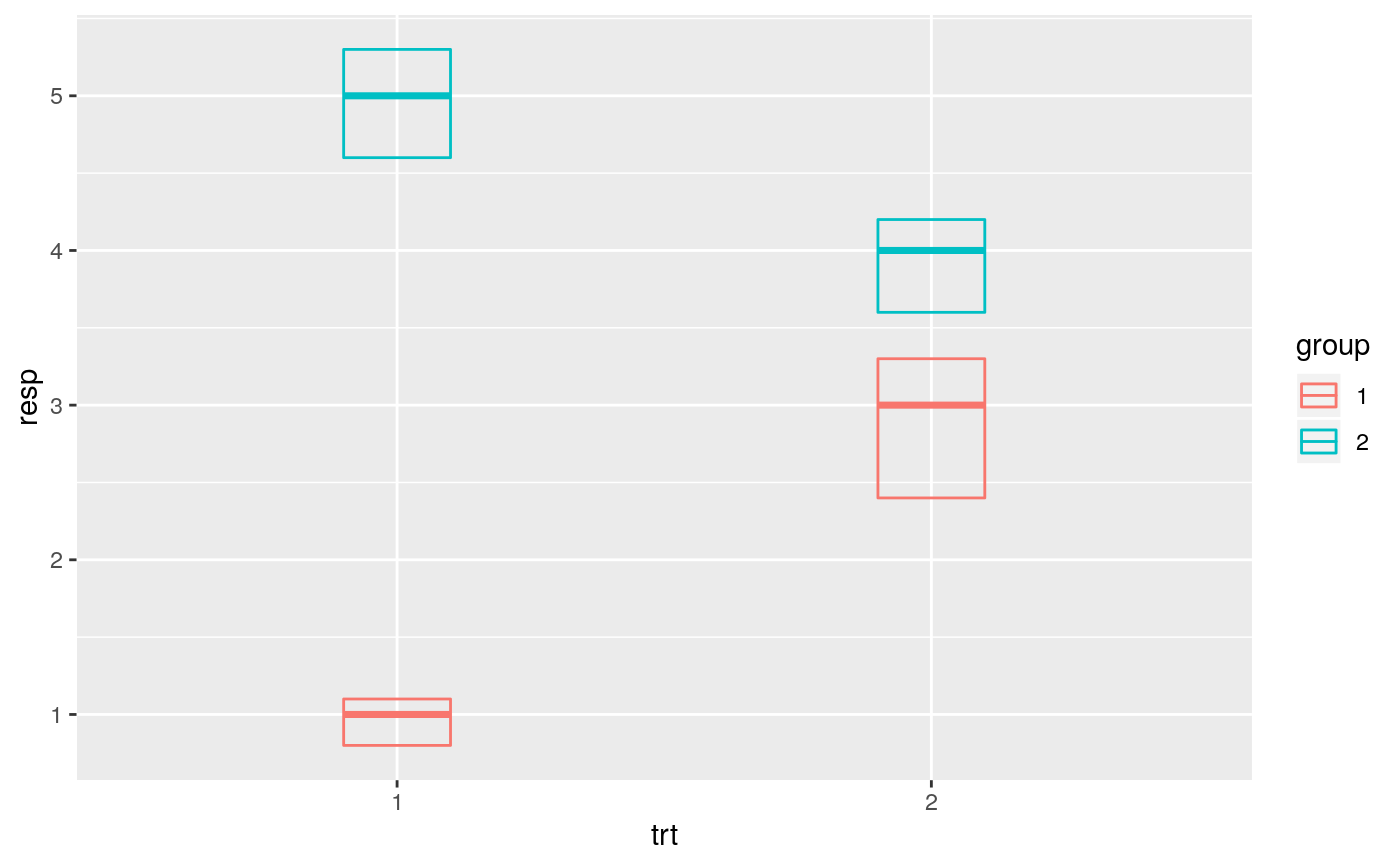
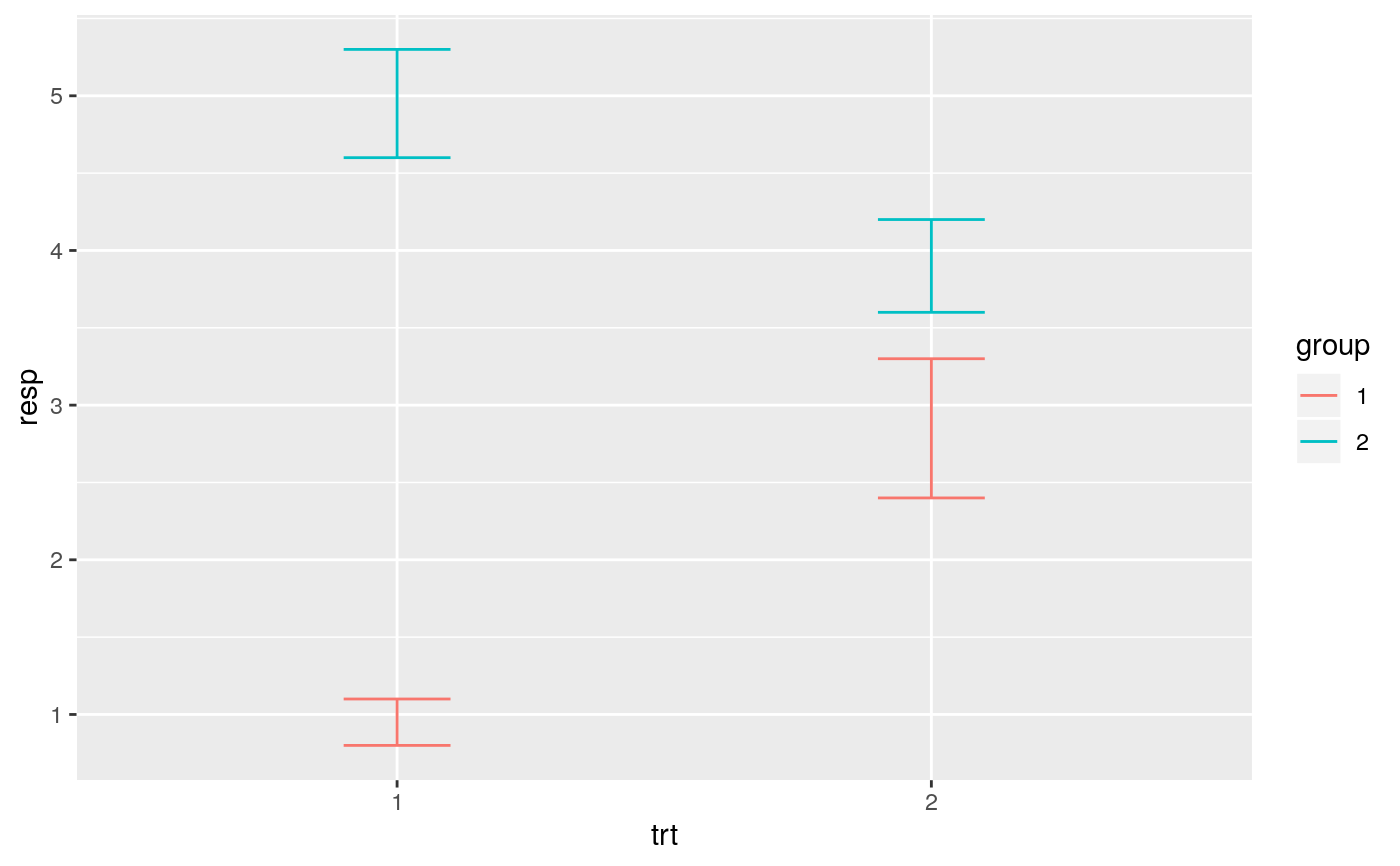
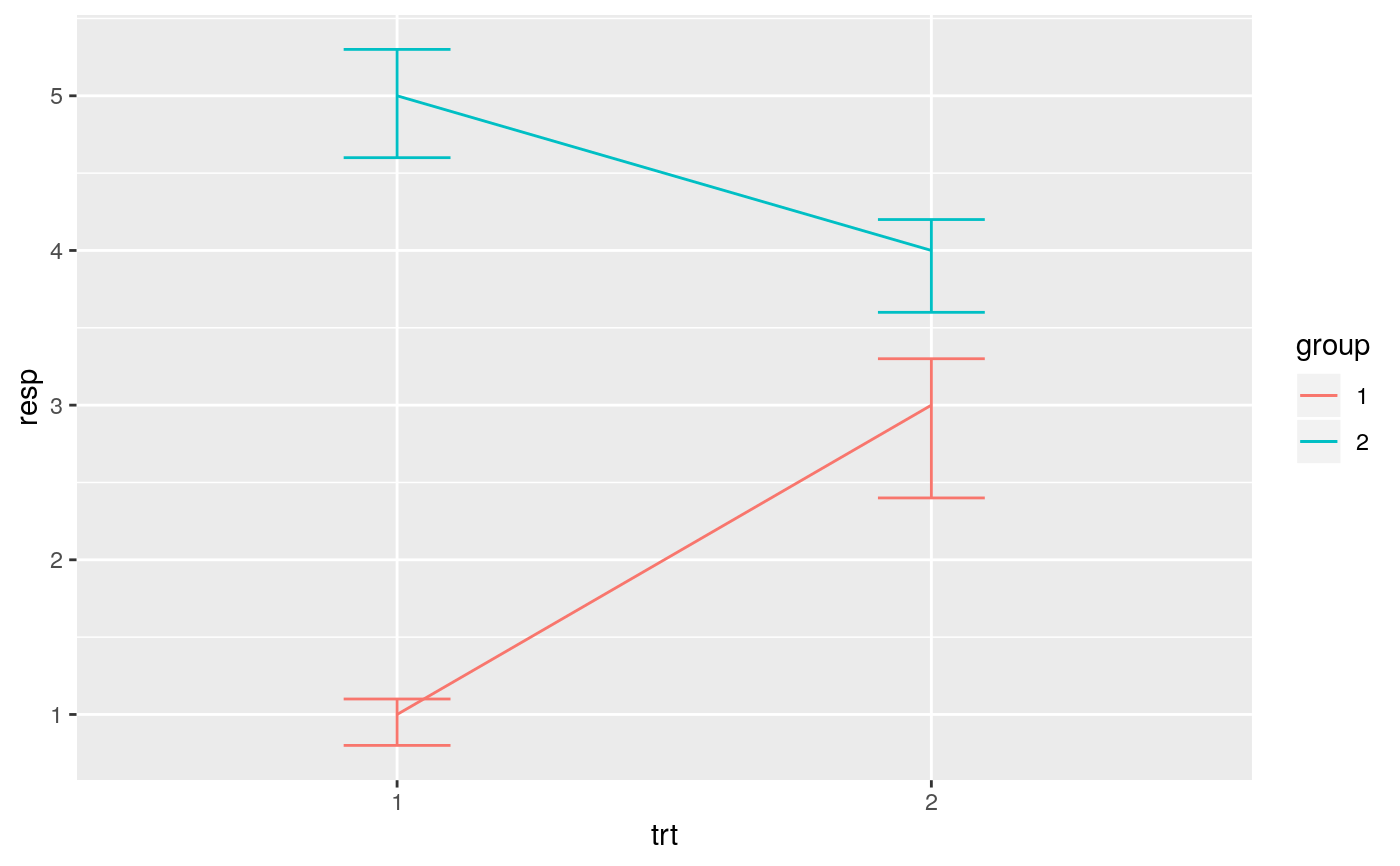
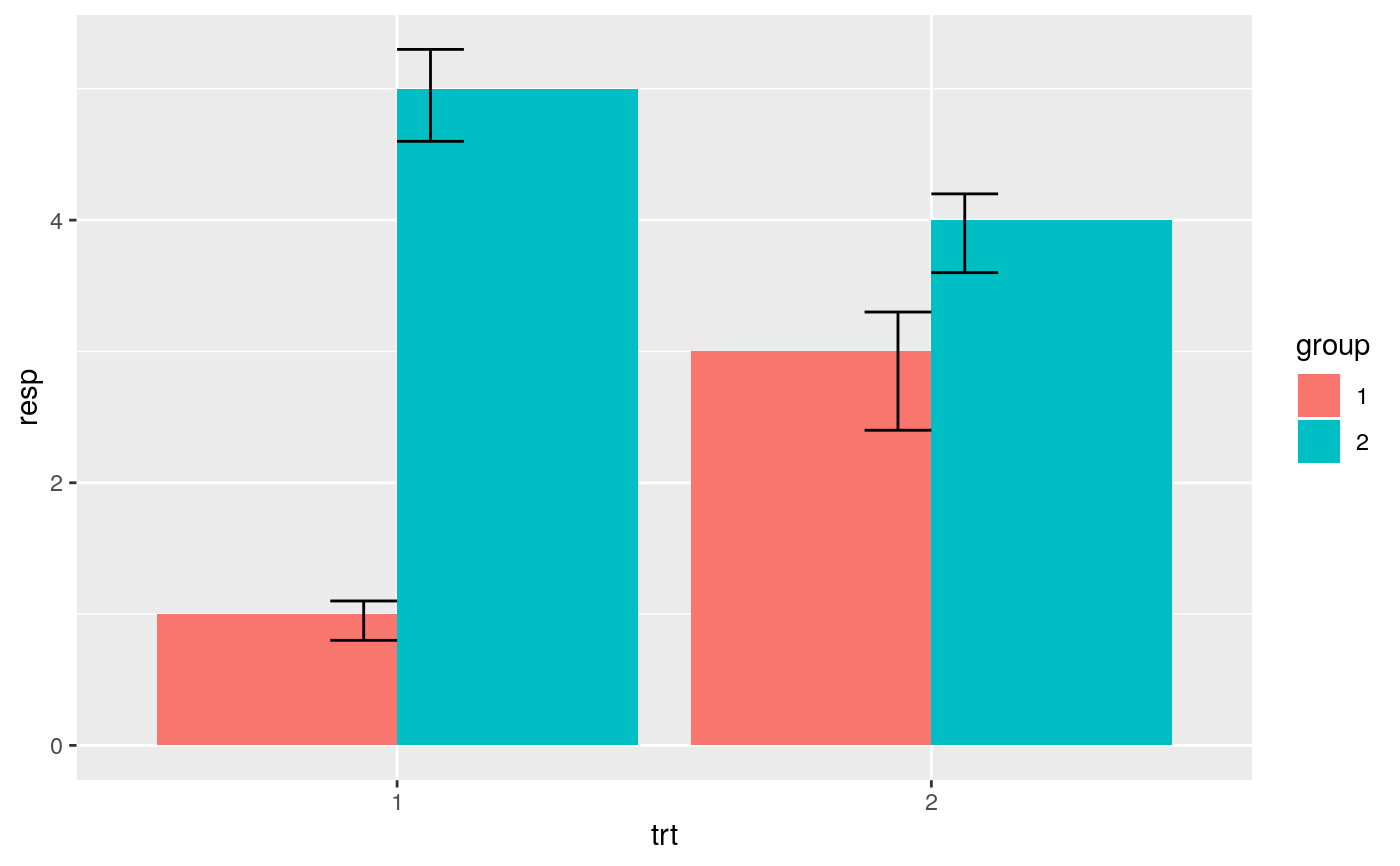
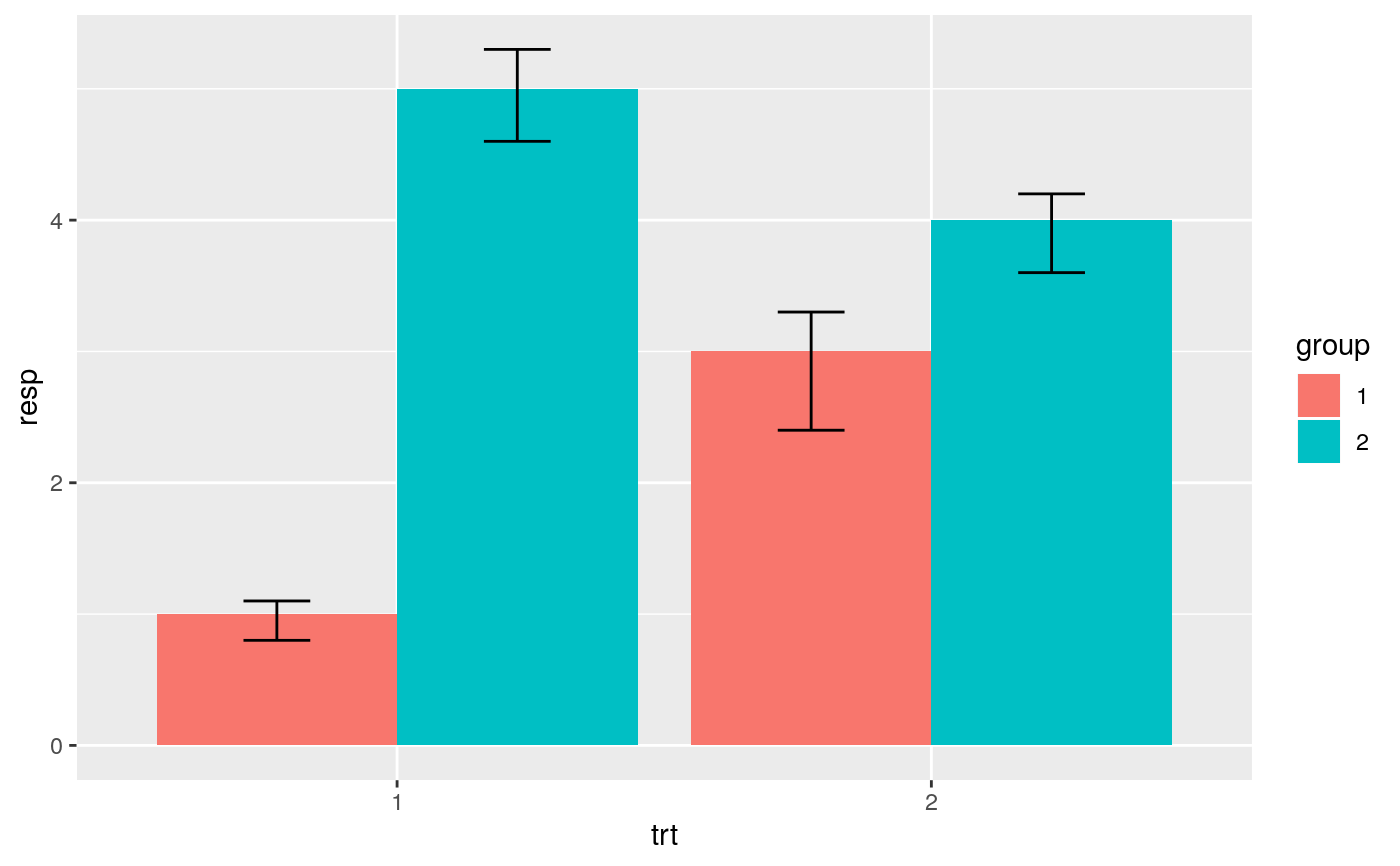
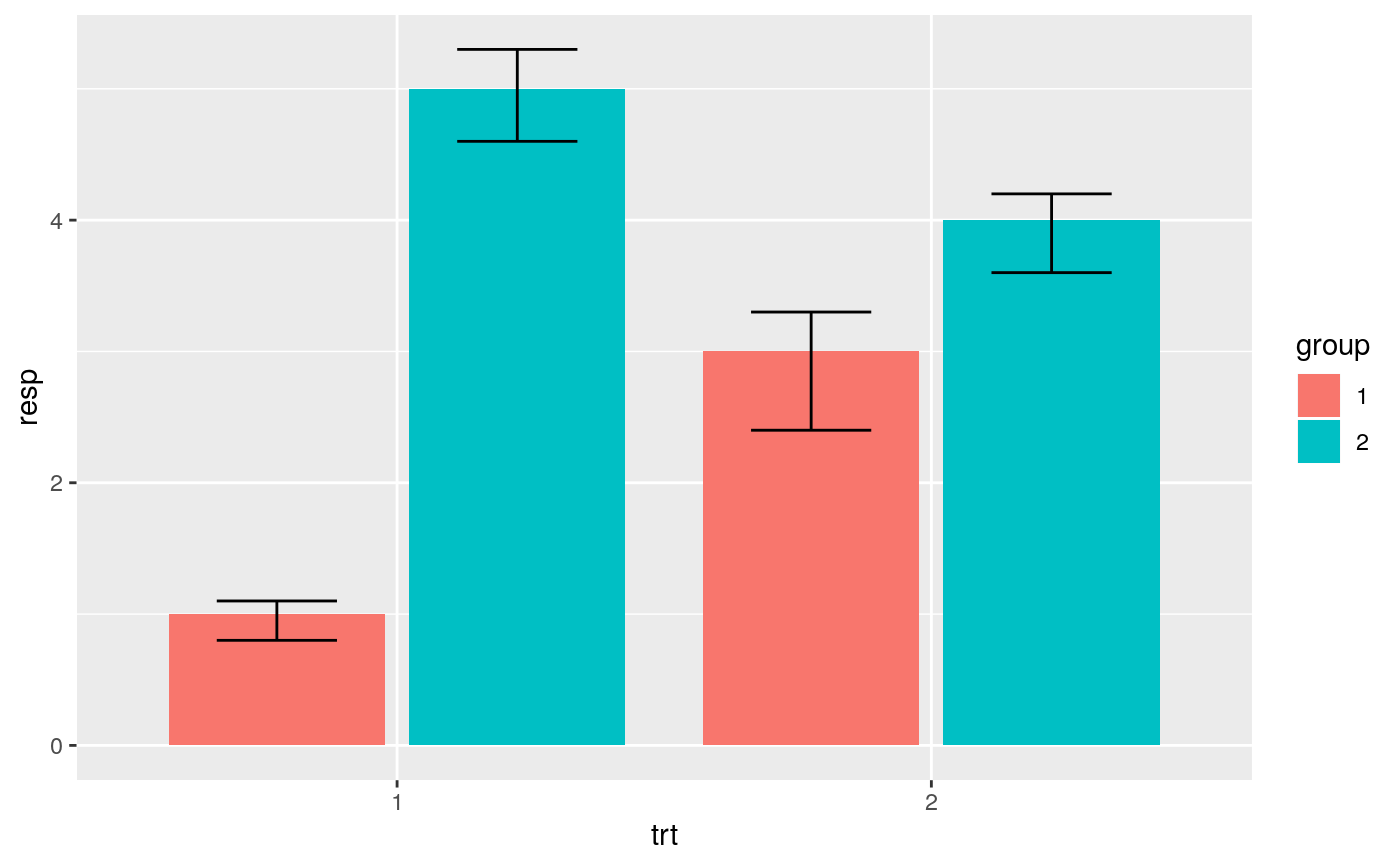
# Create a simple example dataset df <- data.frame( trt = factor(c(1, 1, 2, 2)), resp = c(1, 5, 3, 4), group = factor(c(1, 2, 1, 2)), upper = c(1.1, 5.3, 3.3, 4.2), lower = c(0.8, 4.6, 2.4, 3.6) ) p <- ggplot(df, aes(trt, resp, colour = group)) p + geom_linerange(aes(ymin = lower, ymax = upper))# Draw lines connecting group means p + geom_line(aes(group = group)) + geom_errorbar(aes(ymin = lower, ymax = upper), width = 0.2)# If you want to dodge bars and errorbars, you need to manually # specify the dodge width p <- ggplot(df, aes(trt, resp, fill = group)) p + geom_col(position = "dodge") + geom_errorbar(aes(ymin = lower, ymax = upper), position = "dodge", width = 0.25)# Because the bars and errorbars have different widths # we need to specify how wide the objects we are dodging are dodge <- position_dodge(width=0.9) p + geom_col(position = dodge) + geom_errorbar(aes(ymin = lower, ymax = upper), position = dodge, width = 0.25)# When using geom_errorbar() with position_dodge2(), extra padding will be # needed between the error bars to keep them aligned with the bars. p + geom_col(position = "dodge2") + geom_errorbar( aes(ymin = lower, ymax = upper), position = position_dodge2(width = 0.5, padding = 0.5) )
