Flip cartesian coordinates so that horizontal becomes vertical, and vertical, horizontal. This is primarily useful for converting geoms and statistics which display y conditional on x, to x conditional on y.
coord_flip(xlim = NULL, ylim = NULL, expand = TRUE, clip = "on")Arguments
- xlim
Limits for the x and y axes.
- ylim
Limits for the x and y axes.
- expand
If
TRUE, the default, adds a small expansion factor to the limits to ensure that data and axes don't overlap. IfFALSE, limits are taken exactly from the data orxlim/ylim.- clip
Should drawing be clipped to the extent of the plot panel? A setting of
"on"(the default) means yes, and a setting of"off"means no. In most cases, the default of"on"should not be changed, as settingclip = "off"can cause unexpected results. It allows drawing of data points anywhere on the plot, including in the plot margins. If limits are set viaxlimandylimand some data points fall outside those limits, then those data points may show up in places such as the axes, the legend, the plot title, or the plot margins.
Examples
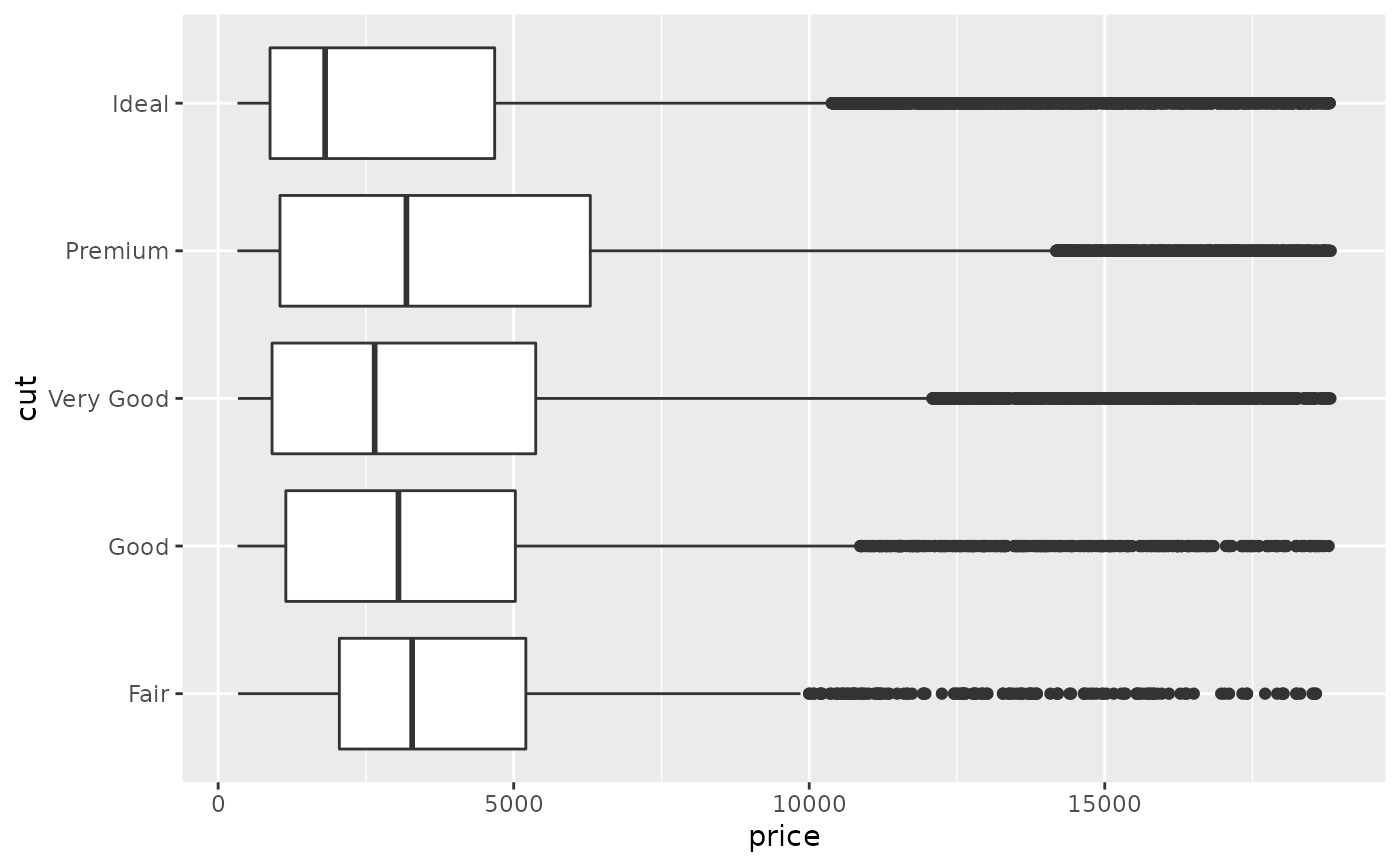
# Very useful for creating boxplots, and other interval
# geoms in the horizontal instead of vertical position.
ggplot(diamonds, aes(cut, price)) +
geom_boxplot() +
coord_flip()
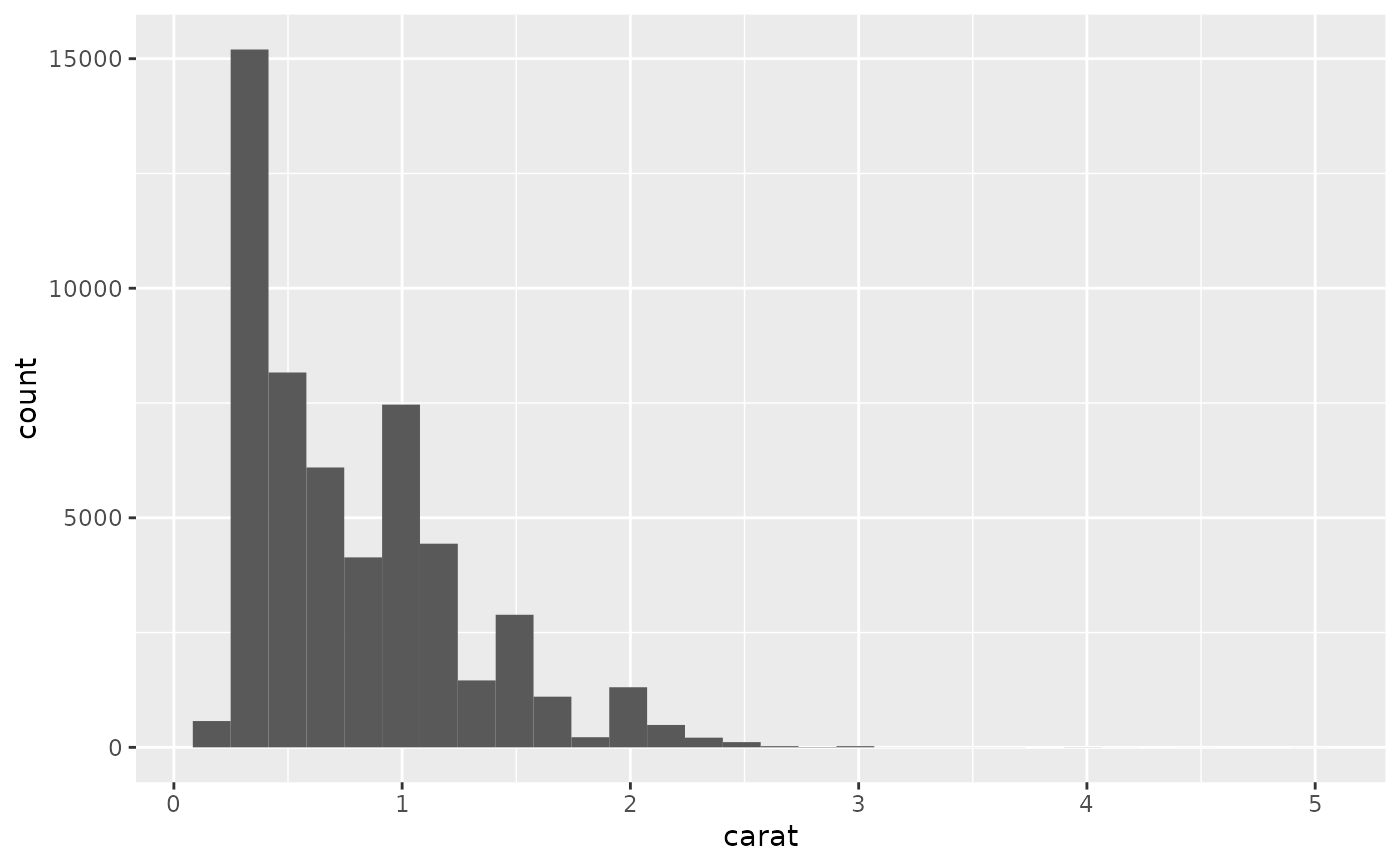
 h <- ggplot(diamonds, aes(carat)) +
geom_histogram()
h
#> `stat_bin()` using `bins = 30`. Pick better value with `binwidth`.
h <- ggplot(diamonds, aes(carat)) +
geom_histogram()
h
#> `stat_bin()` using `bins = 30`. Pick better value with `binwidth`.
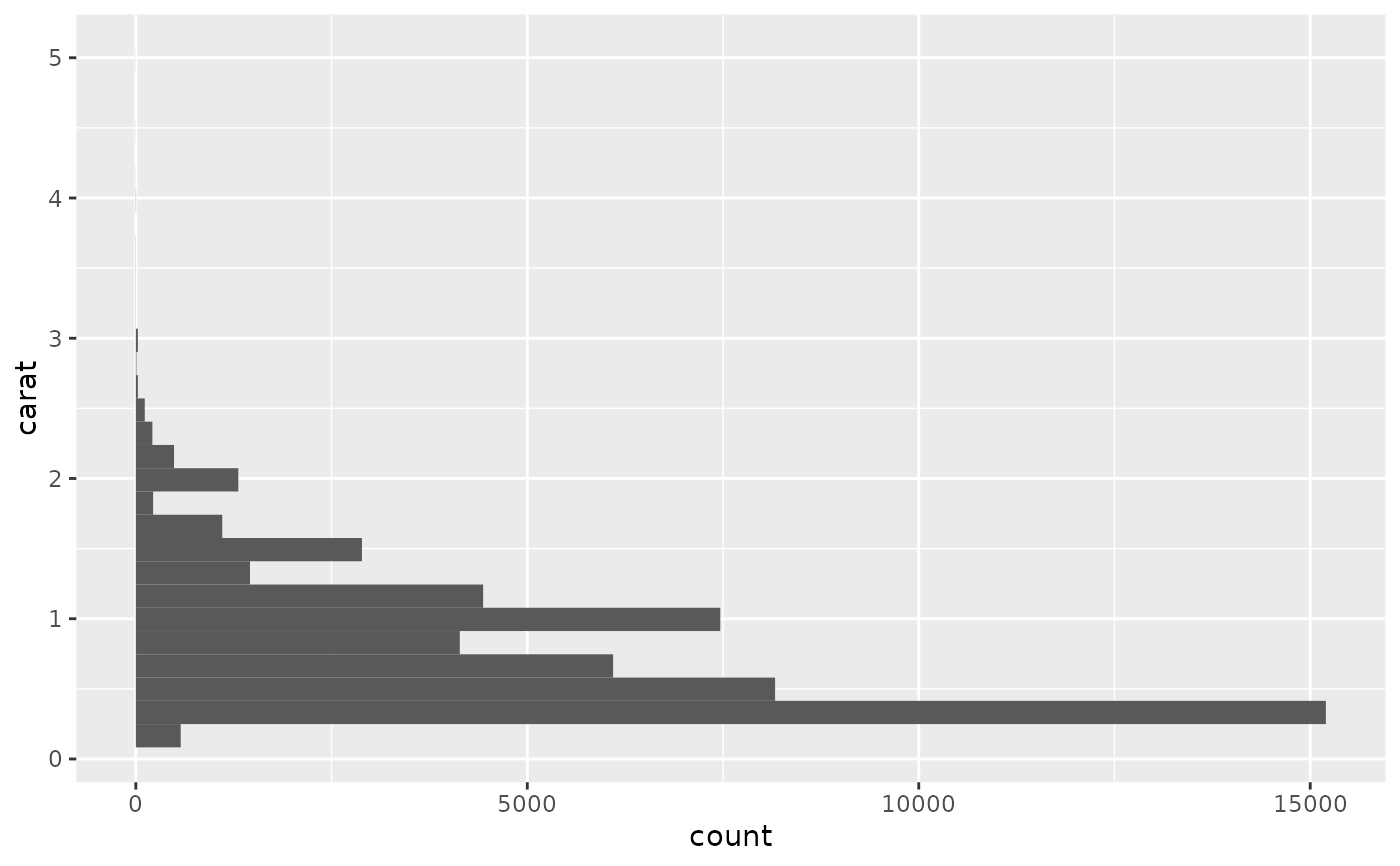
 h + coord_flip()
#> `stat_bin()` using `bins = 30`. Pick better value with `binwidth`.
h + coord_flip()
#> `stat_bin()` using `bins = 30`. Pick better value with `binwidth`.
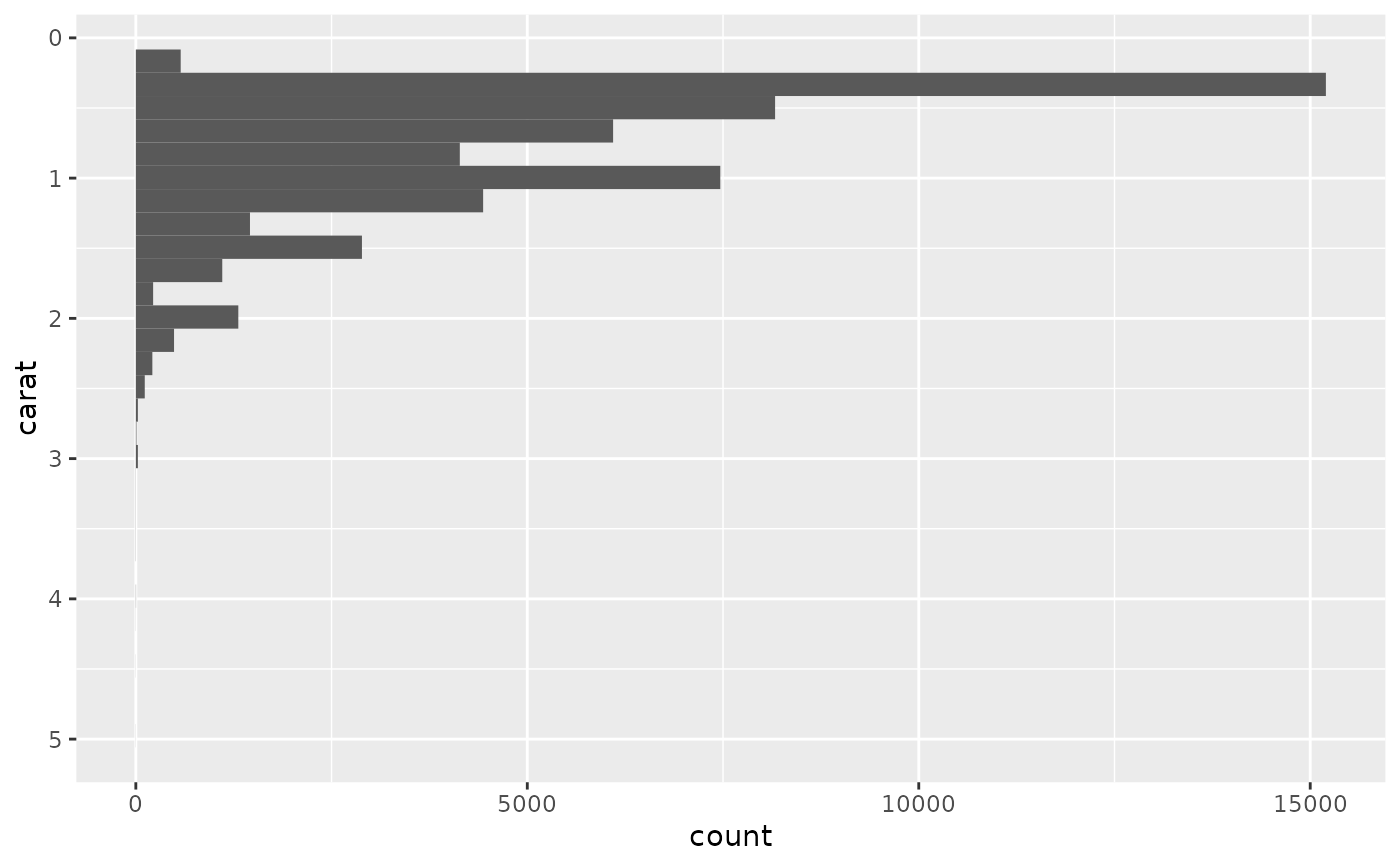
 h + coord_flip() + scale_x_reverse()
#> `stat_bin()` using `bins = 30`. Pick better value with `binwidth`.
h + coord_flip() + scale_x_reverse()
#> `stat_bin()` using `bins = 30`. Pick better value with `binwidth`.
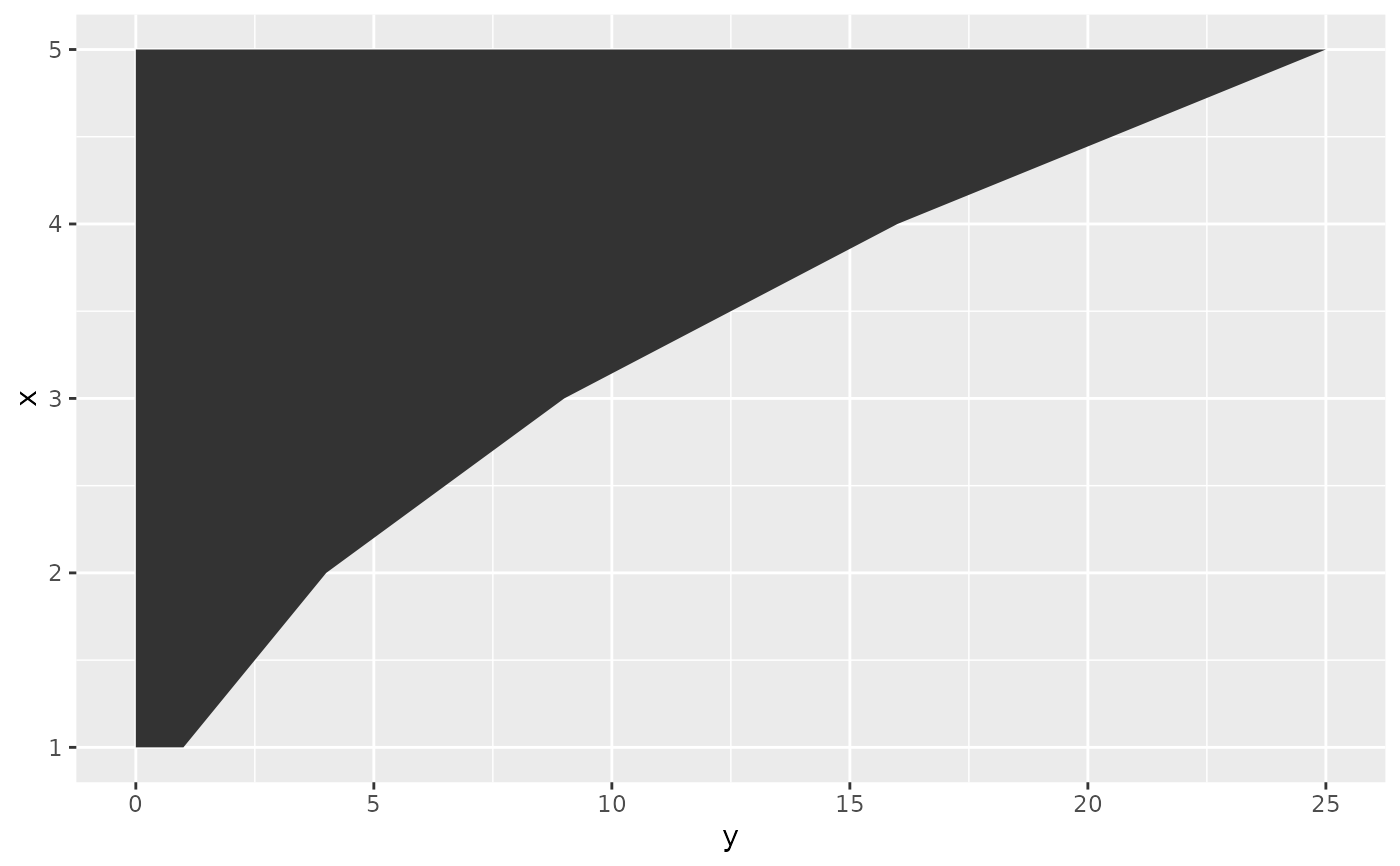
 # You can also use it to flip line and area plots:
df <- data.frame(x = 1:5, y = (1:5) ^ 2)
ggplot(df, aes(x, y)) +
geom_area()
# You can also use it to flip line and area plots:
df <- data.frame(x = 1:5, y = (1:5) ^ 2)
ggplot(df, aes(x, y)) +
geom_area()
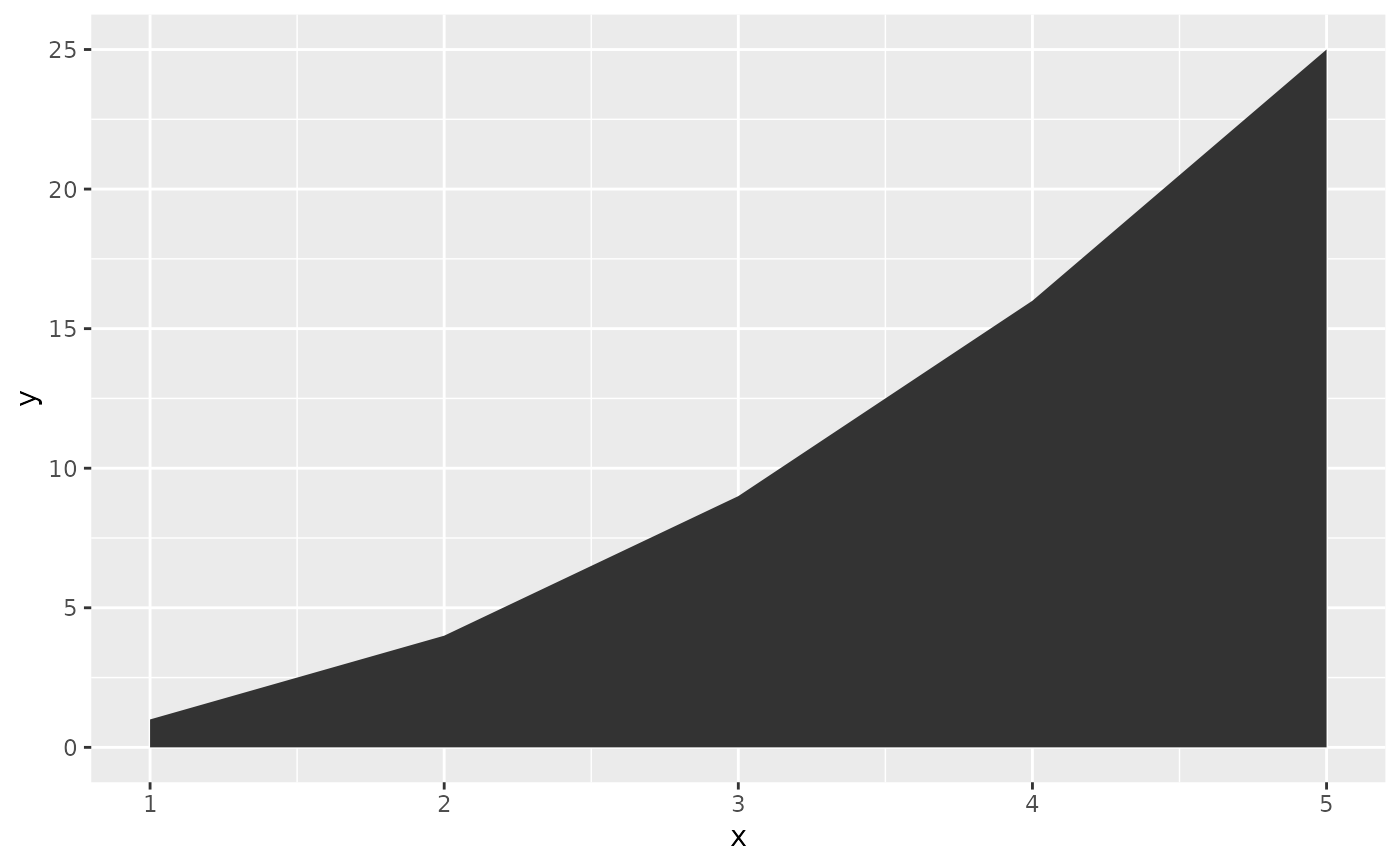 last_plot() + coord_flip()