The cells_grand_summary() function is used to target the cells in a grand
summary and it is useful when applying a footnote with tab_footnote() or
adding custom styles with tab_style(). The function is expressly used in
each of those functions' locations argument.
cells_grand_summary(columns = TRUE, rows = TRUE)
Arguments
| columns | The names of the columns that are to be targeted. |
|---|---|
| rows | The names of the rows that are to be targeted. |
Value
A list object with the classes cells_summary and location_cells.
Details
When using any of the location helper functions with an appropriate function
that has a locations argument, multiple locations can be targeted by
enclosing several cells_*() helper functions in a list(). The following
helper functions can be used to target cells (roughly in order from the top
to the bottom of a table):
cells_title(): targets the table title or the table subtitle depending on the value given to thegroupsargument ("title"or"subtitle").cells_stubhead(): targets the stubhead location, a cell of which is only available when there is a stub; a label in that location can be created by using thetab_stubhead()function.cells_column_spanners(): targets the spanner column labels, which appear above the column labels.cells_column_labels(): targets the column labels.cells_row_groups(): targets the row group labels in any available row groups using thegroupsargument.cells_stub(): targets row labels in the table stub using therowsargument.cells_body(): targets data cells in the table body using intersections ofcolumnsandrows.cells_summary(): targets summary cells in the table body using thegroupsargument and intersections ofcolumnsandrows.cells_grand_summary(): targets cells of the table's grand summary using intersections ofcolumnsandrows
Figures
Function ID
7-13
See also
Other Helper Functions:
adjust_luminance(),
cell_borders(),
cell_fill(),
cell_text(),
cells_body(),
cells_column_labels(),
cells_column_spanners(),
cells_row_groups(),
cells_stubhead(),
cells_stub(),
cells_summary(),
cells_title(),
currency(),
escape_latex(),
gt_latex_dependencies(),
html(),
md(),
pct(),
px(),
random_id()
Examples
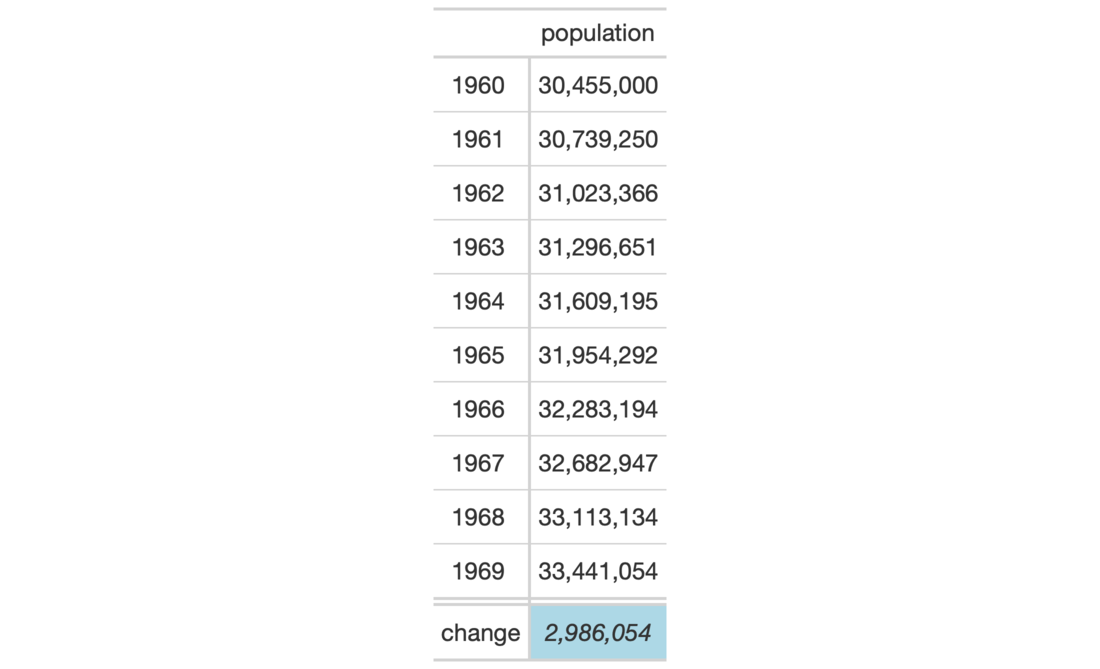
# Use `countrypops` to create a gt table; add
# some styling to a grand summary cell with
# with `tab_style()` and `cells_grand_summary()`
tab_1 <-
  countrypops %>%
  dplyr::filter(
    country_name == "Spain",
    year < 1970
  ) %>%
  dplyr::select(-contains("country")) %>%
  gt(rowname_col = "year") %>%
  fmt_number(
    columns = vars(population),
    decimals = 0
  ) %>%
  grand_summary_rows(
    columns = vars(population),
    fns = list(
      change = ~max(.) - min(.)
    ),
    formatter = fmt_number,
    decimals = 0
  ) %>%
  tab_style(
    style = list(
      cell_text(style = "italic"),
      cell_fill(color = "lightblue")
    ),
    locations = cells_grand_summary(
      columns = vars(population),
      rows = 1)
  )