Plot data as an mrgsims object
plot_sims(.data, ..., .f = NULL, .dots = list())
Arguments
| .data | a data frame |
|---|---|
| ... | unquoted column names to plot on y-axis |
| .f | a formula to plot |
| .dots | extra arguments passed to |
Details
This function is only intended for use with data frames that
were created by modifying an mrgsims object.
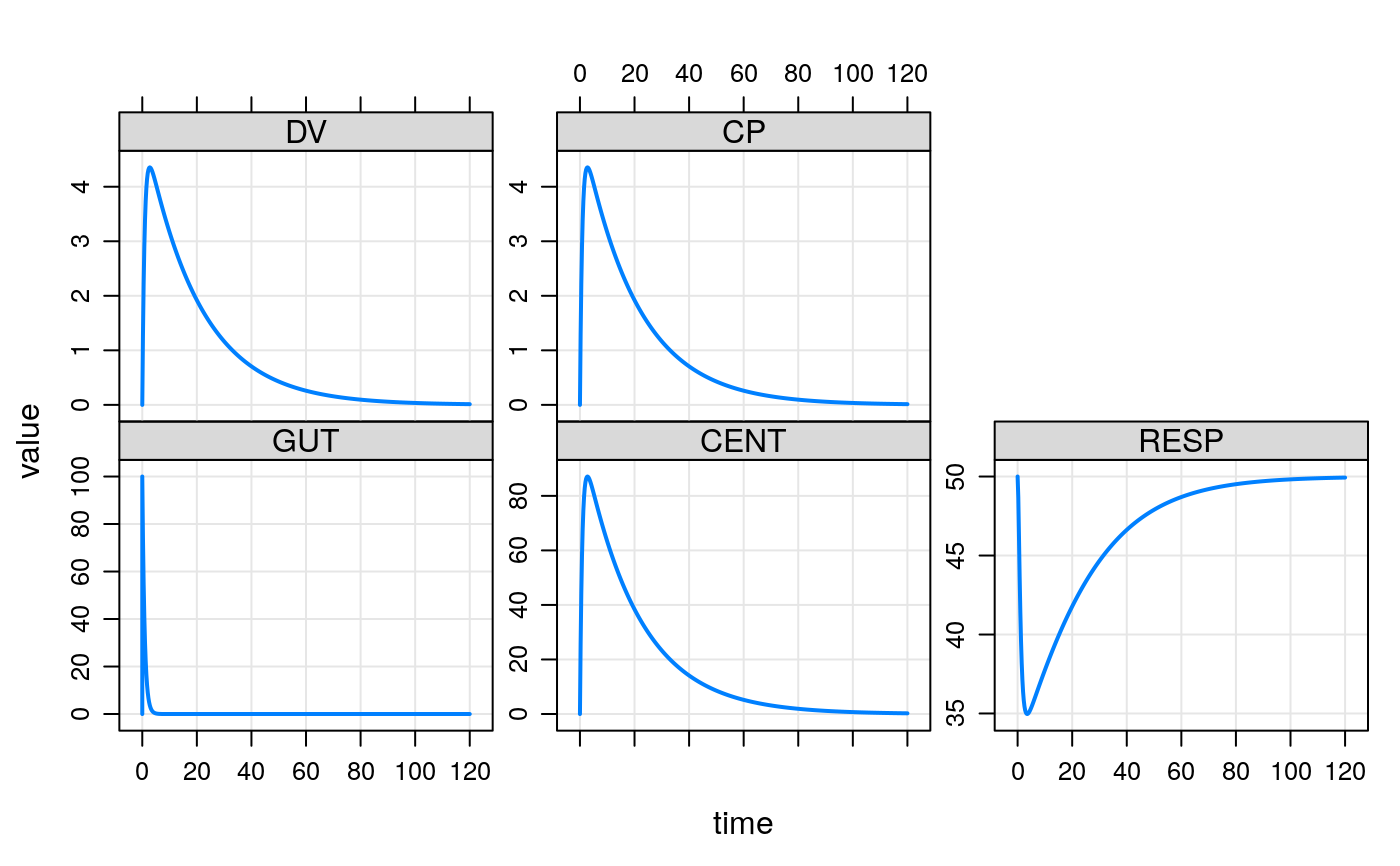
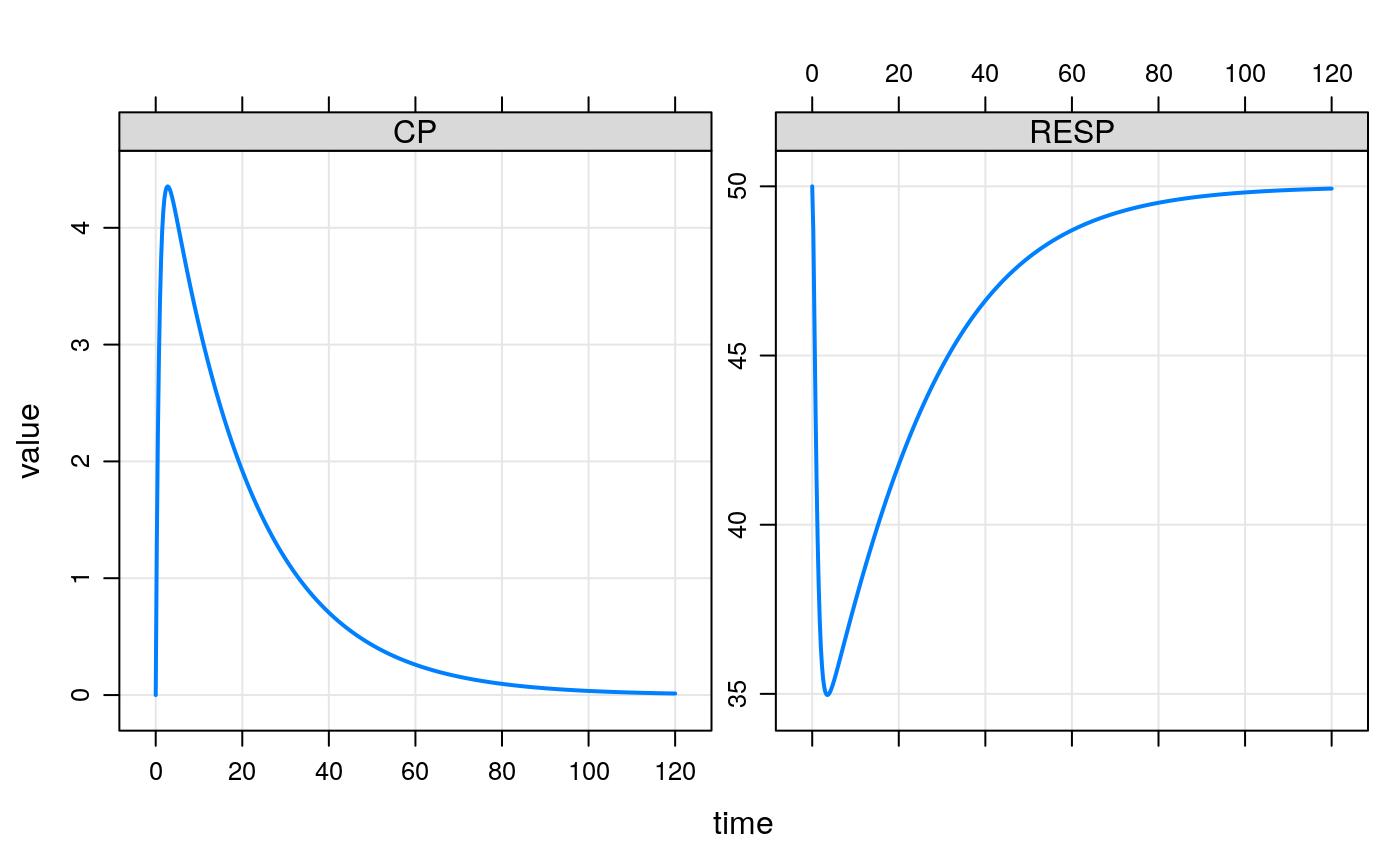
Examples
mod <- mrgsolve::house() %>% ev(amt = 100) out <- mrgsim(mod) out_df <- dplyr::mutate(out, time <= 72) plot(out)plot_sims(out, CP, RESP)if (FALSE) { plot_sims(out, .f = ~ CP + RESP) plot_sims(out, .f = CP + RESP ~ time) }