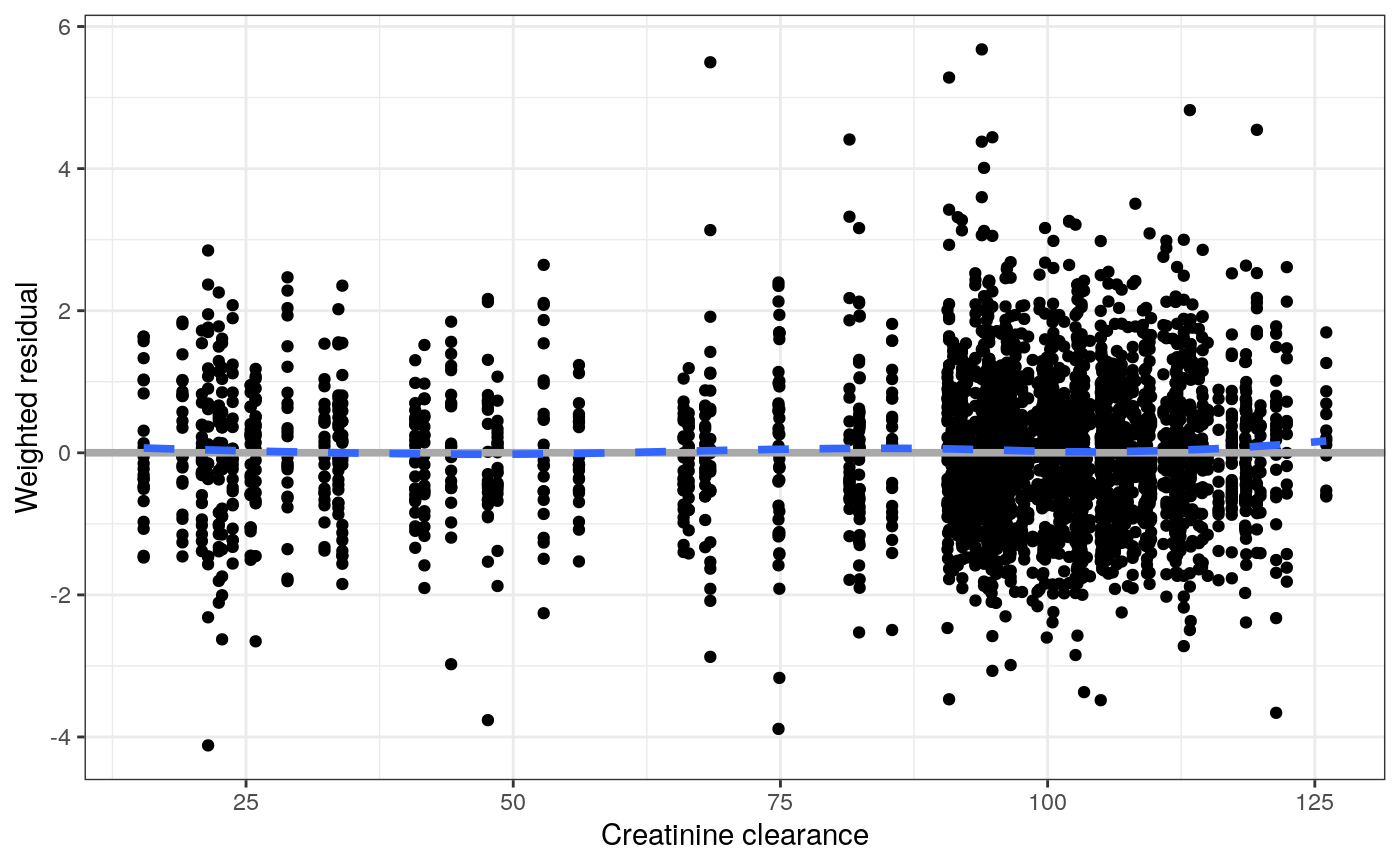
Plot residuals versus continuous variables
res_cont.RdThese are vectorized functions; see details;
res_cont(df, x, y = pm_axis_res(), xs = defx(), ys = defy(), ...)

wres_cont(df, x, y = pm_axis_wres(), xs = defx(), ys = defy(), ...)

cwres_cont(df, x, y = pm_axis_cwres(), xs = defx(), ys = defy(), ...)

cwresi_cont(df, x, y = pm_axis_cwresi(), ...)

npde_cont(df, x, y = pm_axis_npde(), ...)
Arguments
| df | data frame to plot |
|---|---|
| x | character col//title for x-axis data; see
|
| y | character col//title for y-axis data; see
|
| xs | see |
| ys | see |
| ... |
Value
A single plot when a single value for x
and y are supplied; a list of plots of either x
or y have length greater than 1.
Details
These are vectorized functions; if either x or y are a character vector (in col//title format), a list of plots is returned. If both x and y are length 1, then a single plot object (not a list) is returned.
Examples
#>
