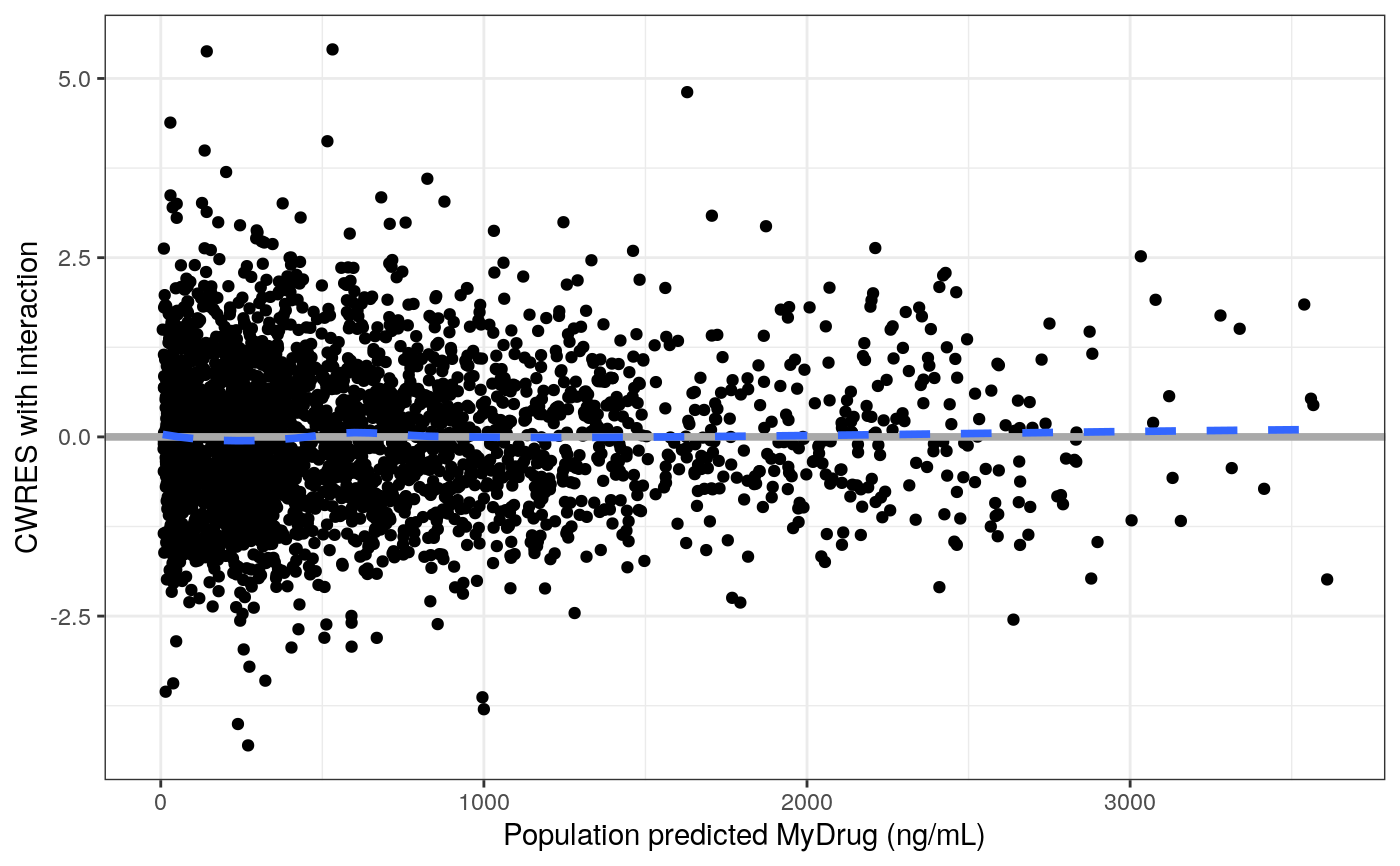
Residuals or NPDE versus predicted values
res_pred.RdResiduals or NPDE versus predicted values
res_pred(
  df,
  x = pm_axis_pred(),
  y = pm_axis_res(),
  xname = "value",
  xs = defx(),
  ys = defy(),
  ...
)

wres_pred(df, ..., y = pm_axis_wres())

cwres_pred(df, ..., y = pm_axis_cwres())

cwresi_pred(df, y = pm_axis_cwresi(), ...)

npde_pred(df, ..., y = pm_axis_npde(), hline = npde_ref())
Arguments
| df | data frame to plot |
|---|---|
| x | character name for x-axis data |
| y | character name for y-axis data |
| xname | glued into x-axis title |
| xs | see |
| ys | see |
| ... | |
| hline | a list of parameters to pass to |
Value
A single plot.
Details
Since this function creates a scatter plot,
both the x and y columns must
be numeric.
The y axis name is always the name of the residual
(e.g. "Weighted residual"). Use the xname argument
to add specific name and or unit to the dependent variable
(see the example).
A loess smooth and a horizontal reference line are layered on the plot.
See also
Examples
#>
