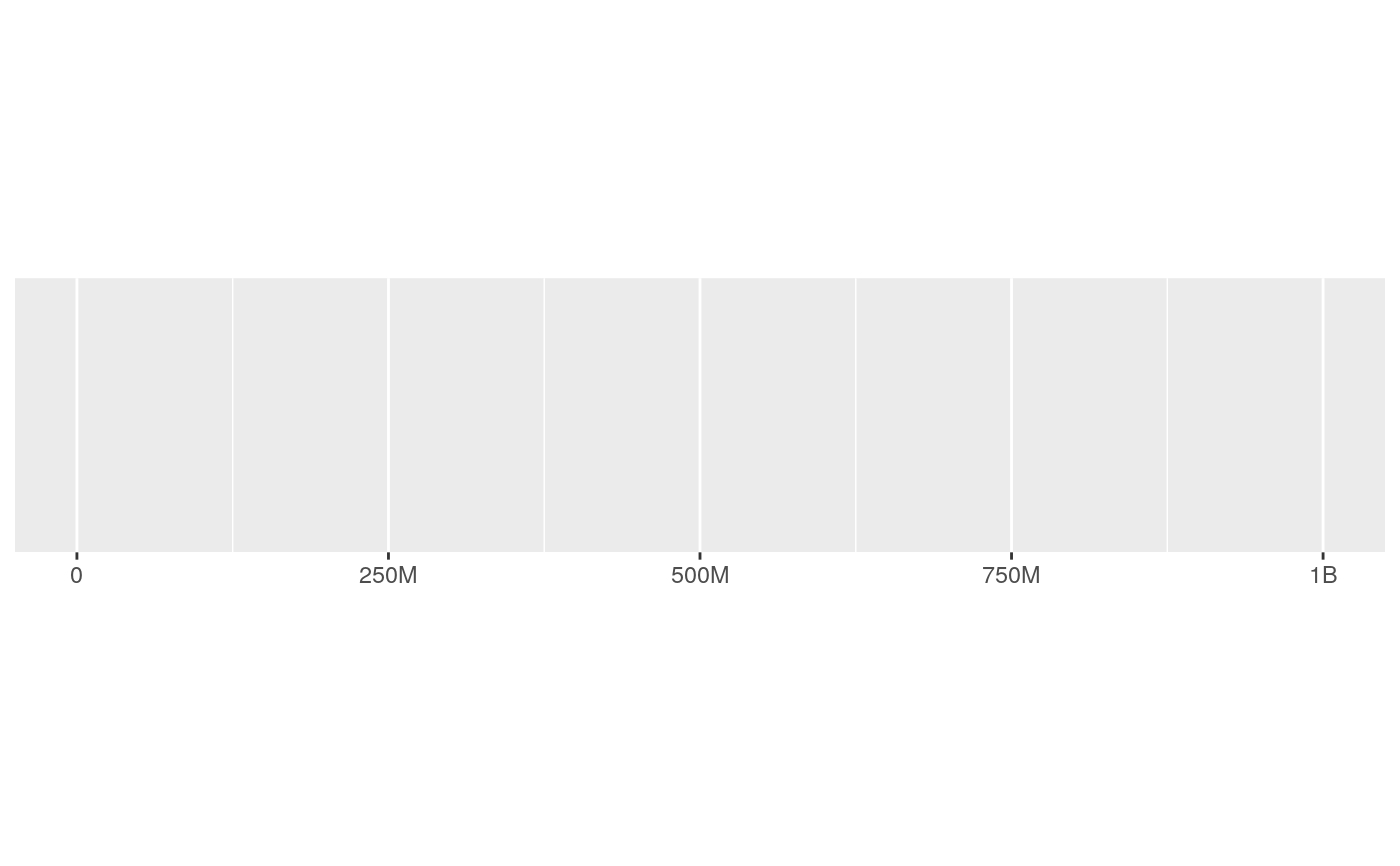
number_si() automatically scales and labels with the best SI prefix,
"K" for values \(\ge\) 10e3, "M" for \(\ge\) 10e6,
"B" for \(\ge\) 10e9, and "T" for \(\ge\) 10e12.
label_number_si(accuracy = 1, unit = NULL, sep = NULL, ...)
Arguments
| accuracy | A number to round to. Use (e.g.) Applied to rescaled data. |
|---|---|
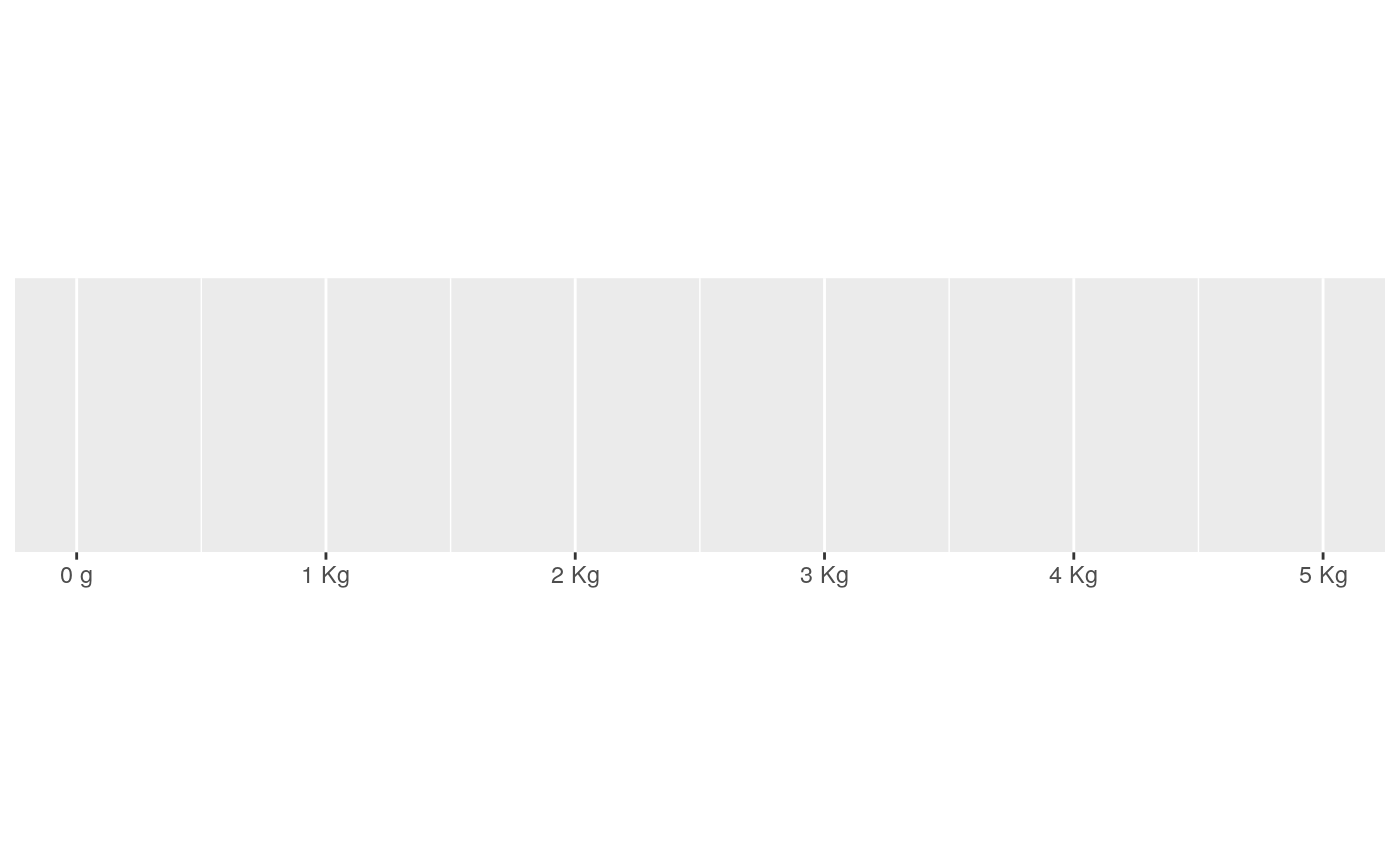
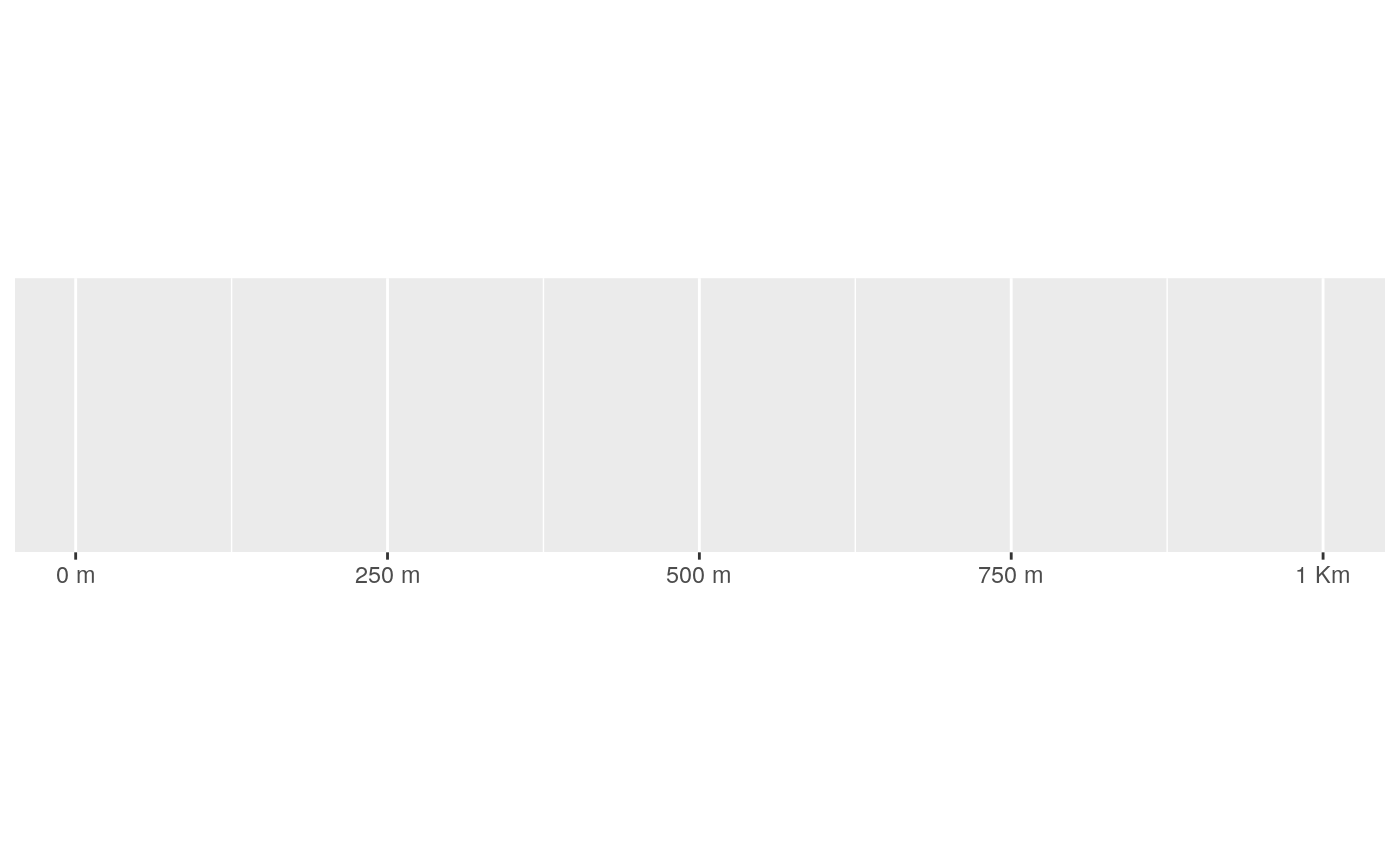
| unit | Optional units specifier. |
| sep | Separator between number and SI unit. Defaults to |
| ... | Other arguments passed on to |
Value
All label_() functions return a "labelling" function, i.e. a function that
takes a vector x and returns a character vector of length(x) giving a
label for each input value.
Labelling functions are designed to be used with the labels argument of
ggplot2 scales. The examples demonstrate their use with x scales, but
they work similarly for all scales, including those that generate legends
rather than axes.
See also
Other labels for continuous scales:
label_bytes(),
label_dollar(),
label_number_auto(),
label_ordinal(),
label_parse(),
label_percent(),
label_pvalue(),
label_scientific()
Other labels for log scales:
label_bytes(),
label_scientific()
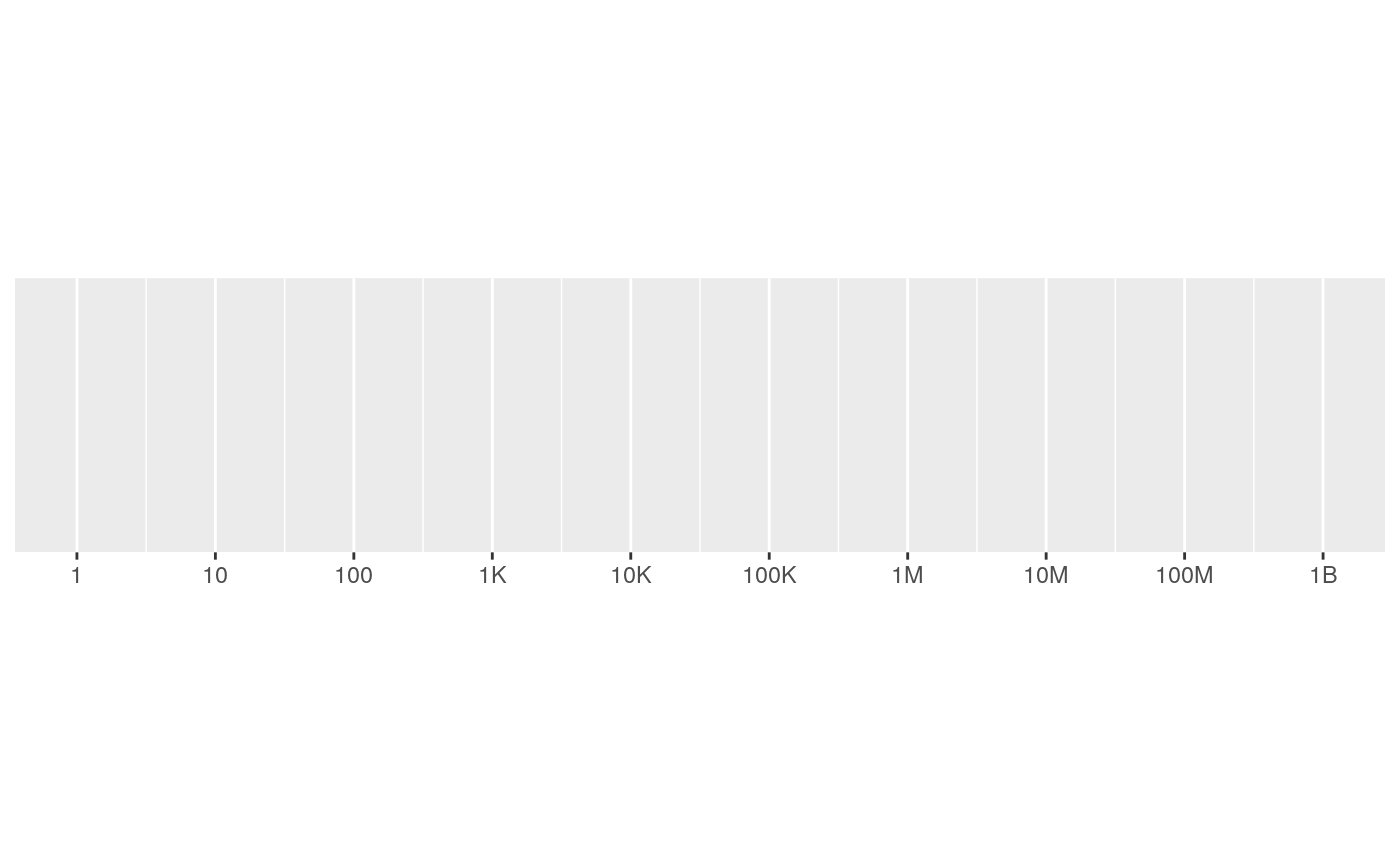
Examples
#> scale_x_continuous(label = label_number_si())#> scale_x_continuous(label = label_number_si(unit = "g"))#> scale_x_continuous(label = label_number_si(unit = "m"))#> scale_x_log10(breaks = log_breaks(10), labels = label_number_si())