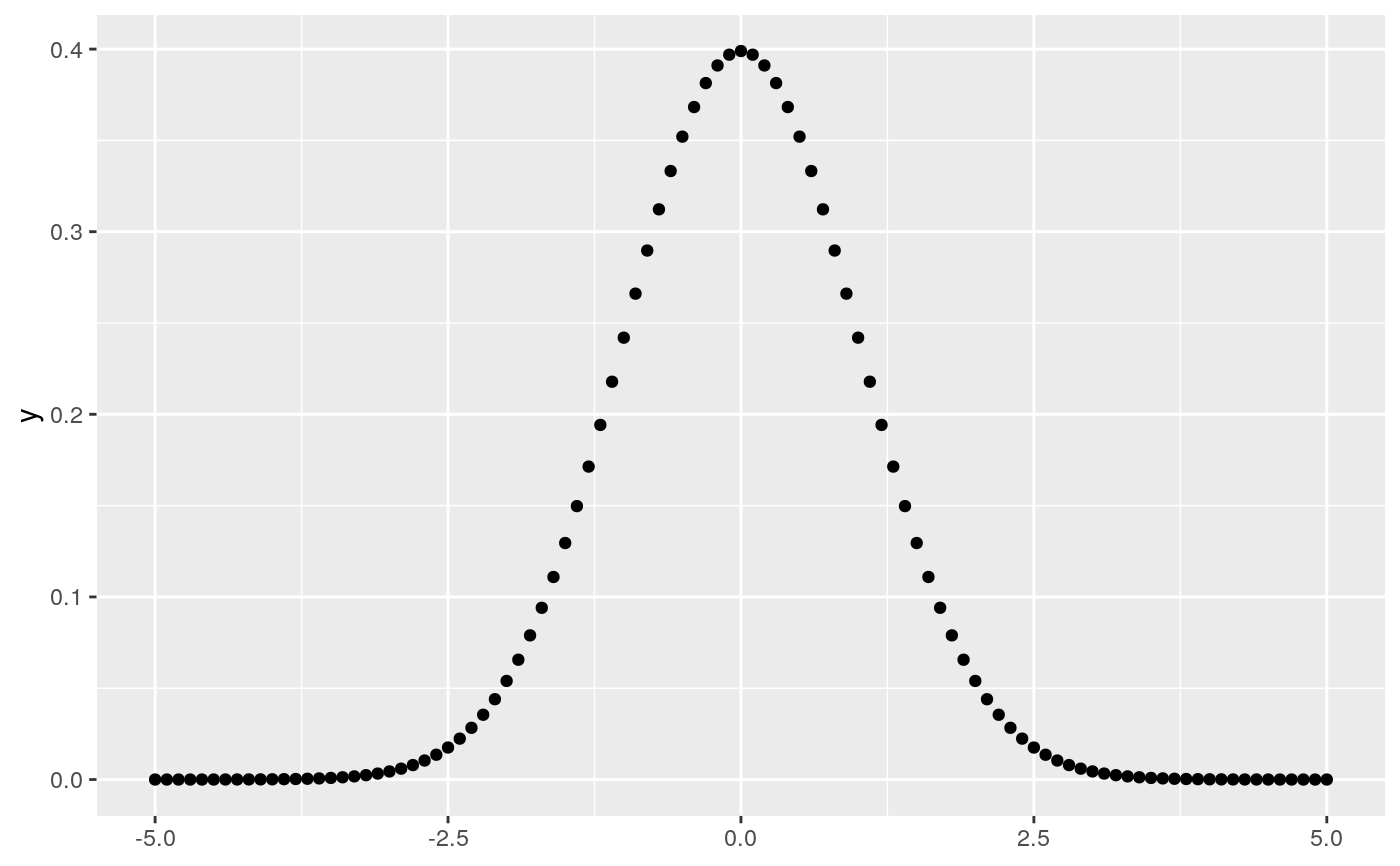
Computes and draws a function as a continuous curve. This makes it easy to superimpose a function on top of an existing plot. The function is called with a grid of evenly spaced values along the x axis, and the results are drawn (by default) with a line.
geom_function(
  mapping = NULL,
  data = NULL,
  stat = "function",
  position = "identity",
  ...,
  na.rm = FALSE,
  show.legend = NA,
  inherit.aes = TRUE
)

stat_function(
  mapping = NULL,
  data = NULL,
  geom = "function",
  position = "identity",
  ...,
  fun,
  xlim = NULL,
  n = 101,
  args = list(),
  na.rm = FALSE,
  show.legend = NA,
  inherit.aes = TRUE
)
Arguments
| mapping | Set of aesthetic mappings created by |
|---|---|
| data | Ignored by |
| stat | The statistical transformation to use on the data for this layer, as a string. |
| position | Position adjustment, either as a string, or the result of a call to a position adjustment function. |
| ... | Other arguments passed on to |
| na.rm | If |
| show.legend | logical. Should this layer be included in the legends?
|
| inherit.aes | If |
| geom | The geometric object to use display the data |
| fun | Function to use. Either 1) an anonymous function in the base or
rlang formula syntax (see |
| xlim | Optionally, restrict the range of the function to this range. |
| n | Number of points to interpolate along the x axis. |
| args | List of additional arguments passed on to the function defined by |
Aesthetics
geom_function() understands the following aesthetics (required aesthetics are in bold):
xyalphacolourgrouplinetypesize
Learn more about setting these aesthetics in vignette("ggplot2-specs").
Computed variables
stat_function() computes the following variables:
x values along a grid
value of the function evaluated at corresponding x
See also
Examples
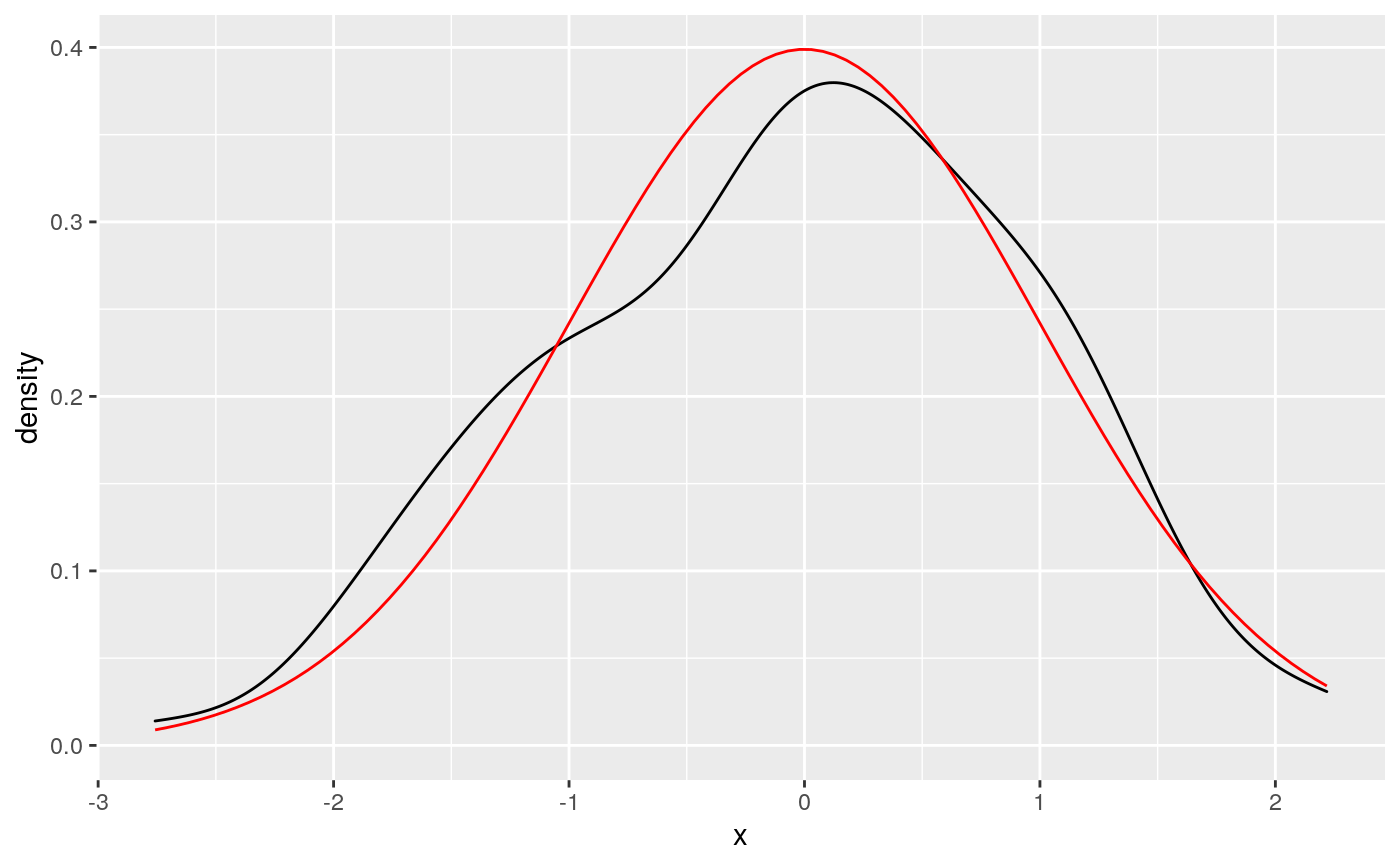
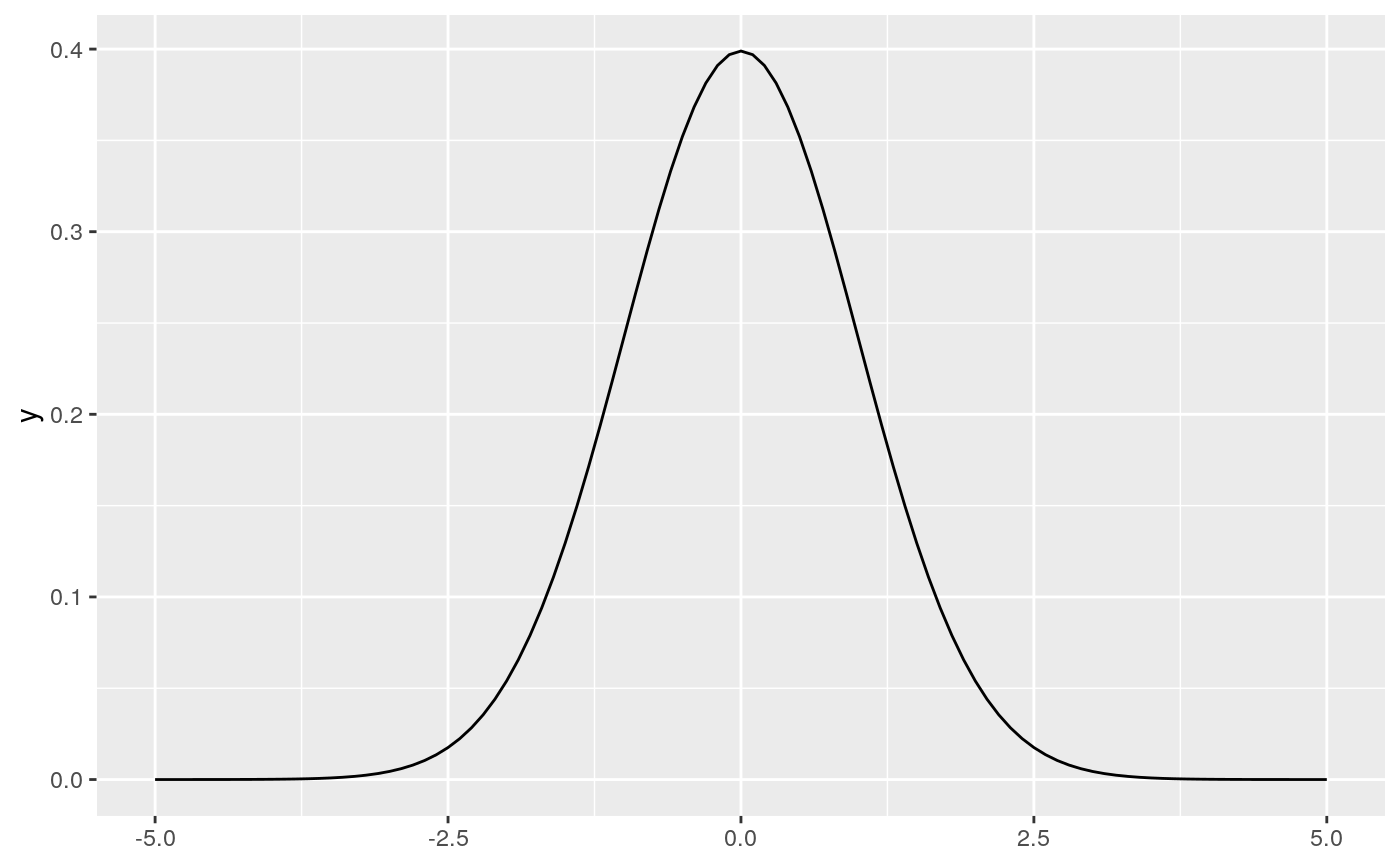
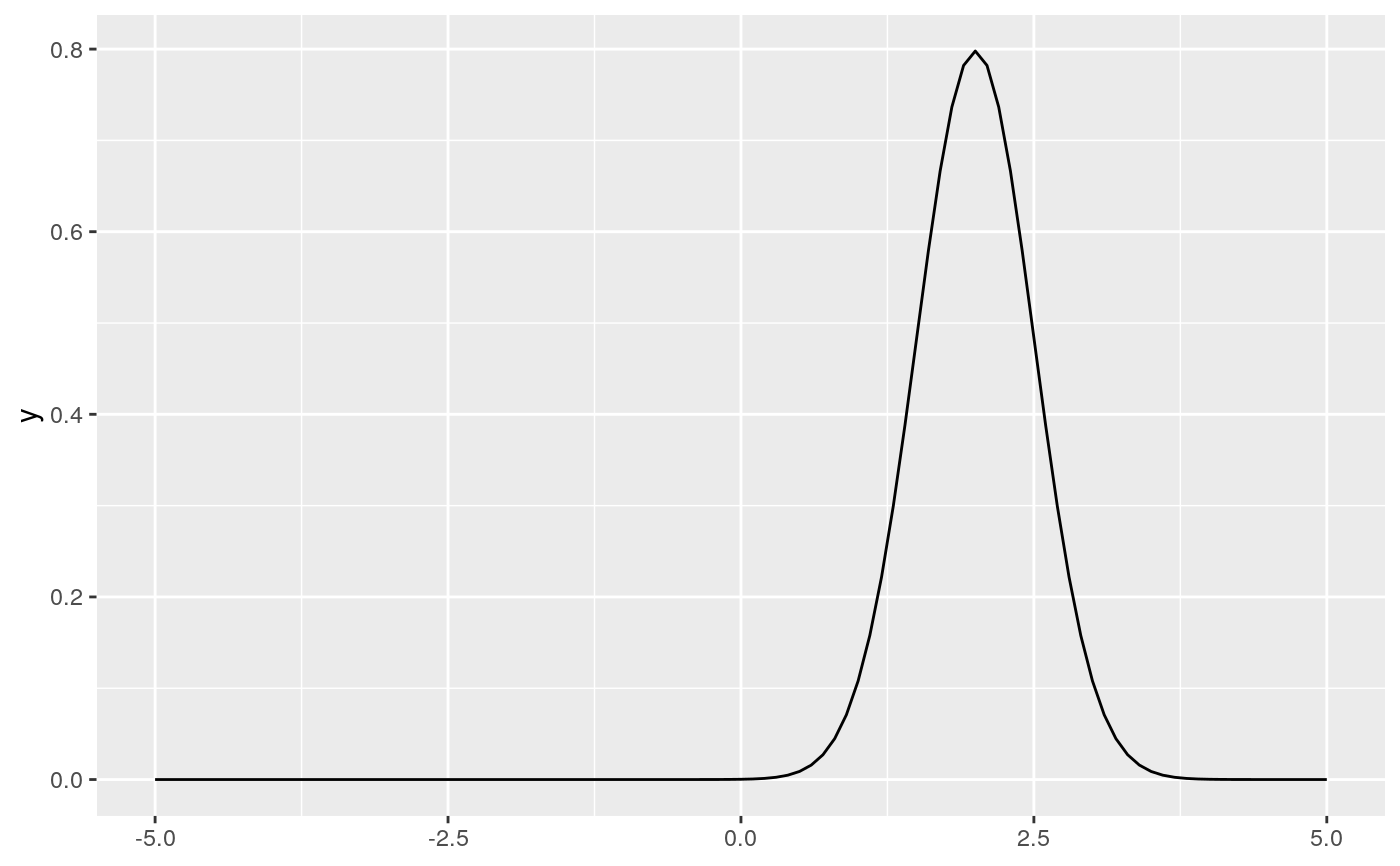
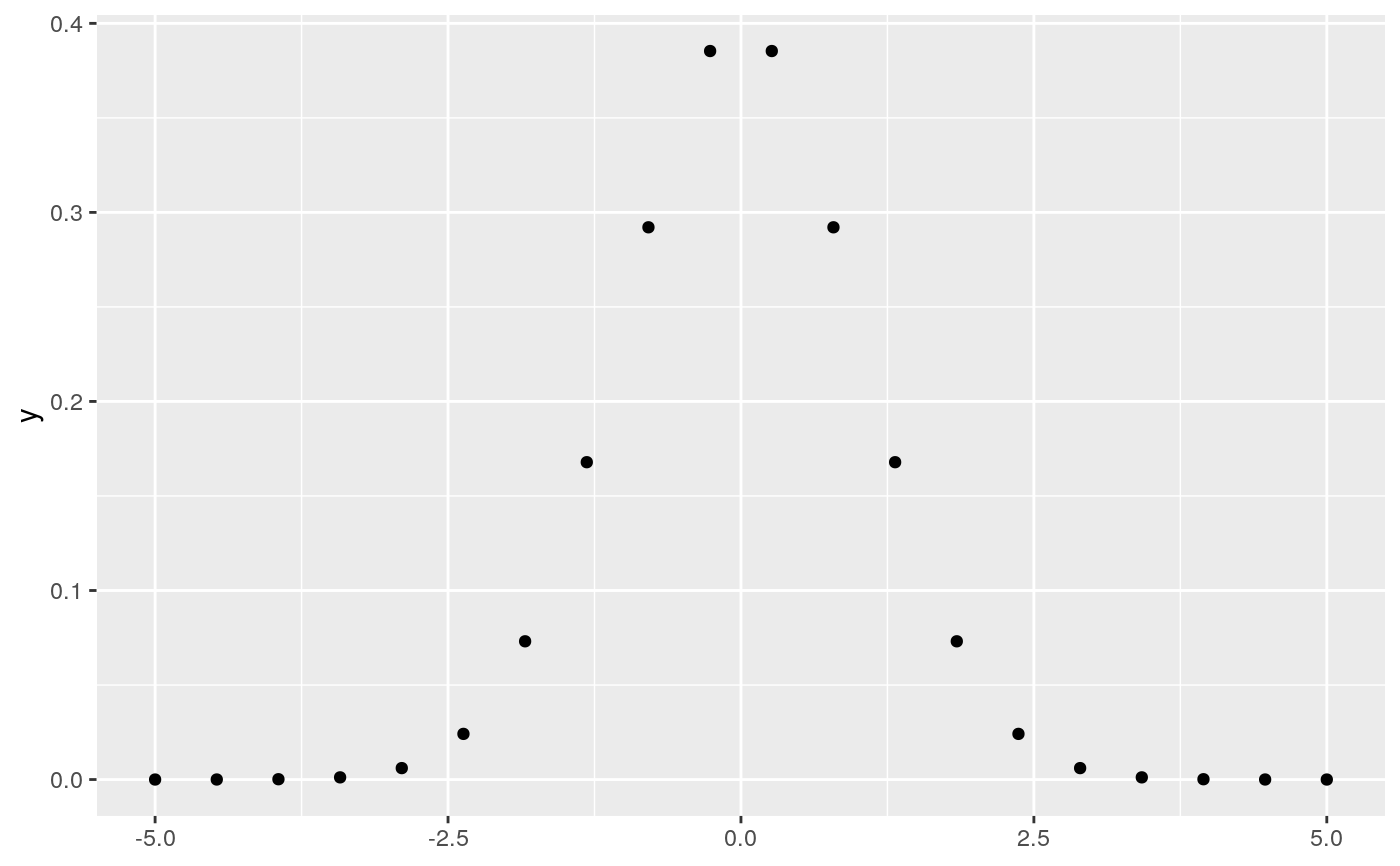
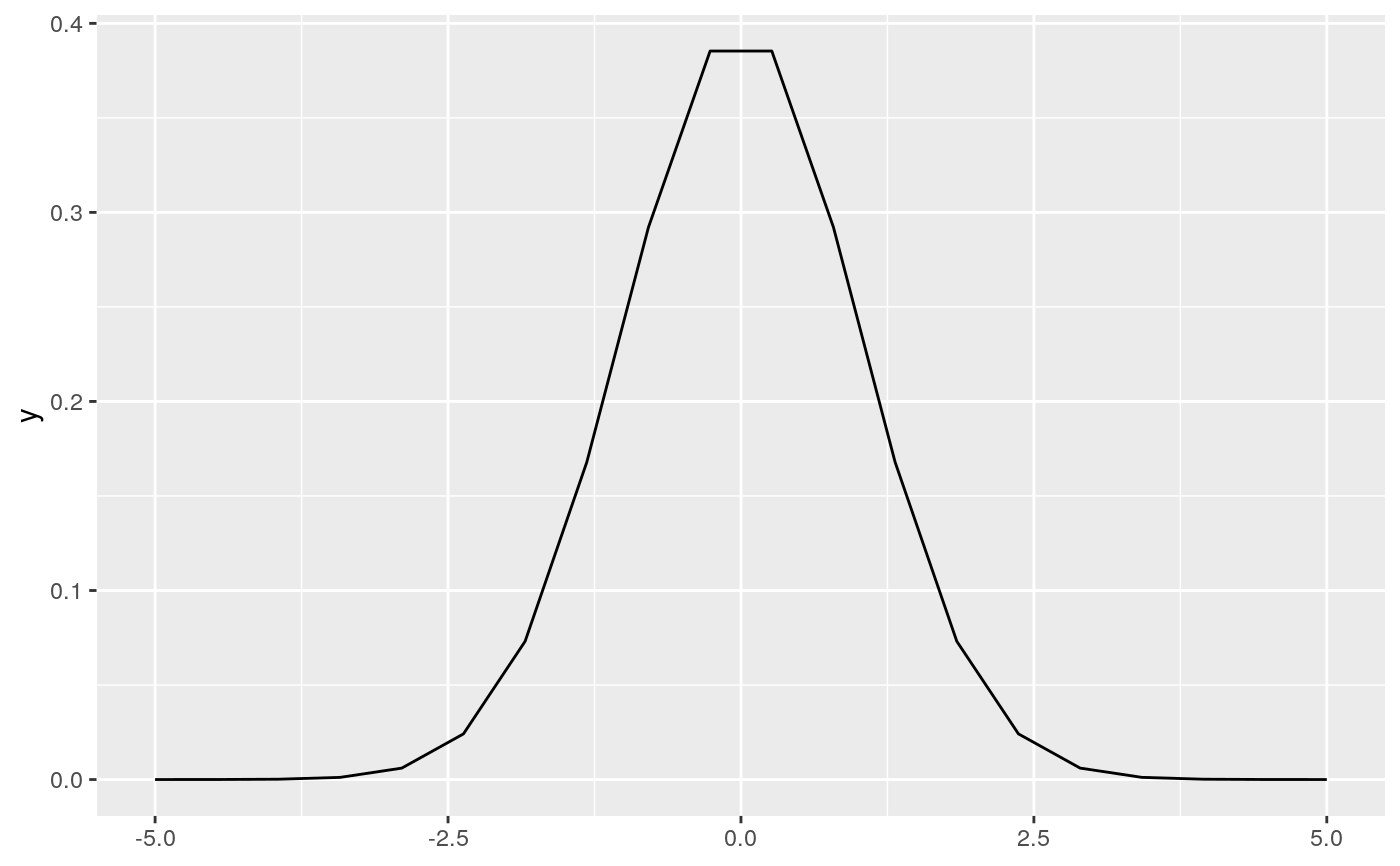
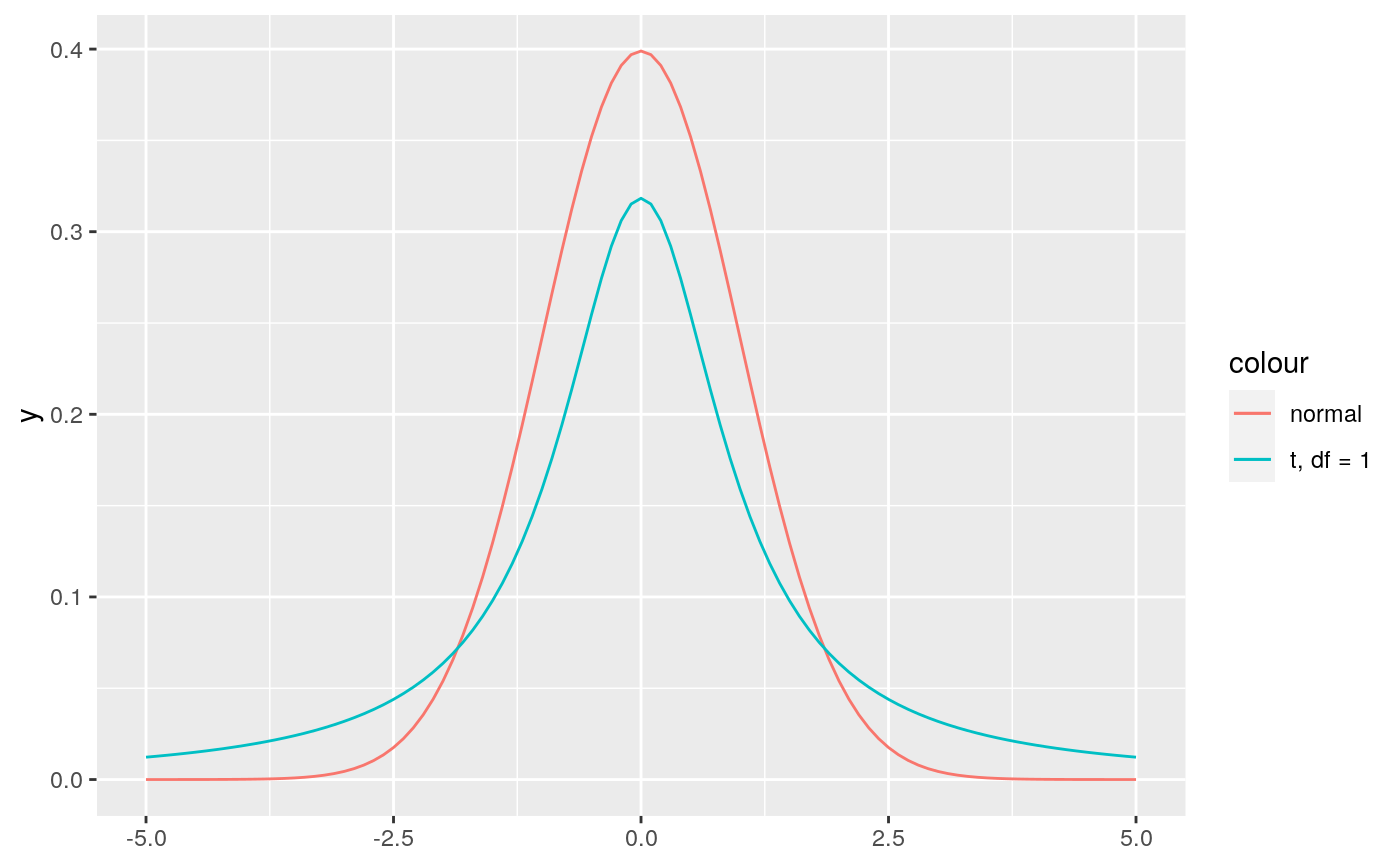
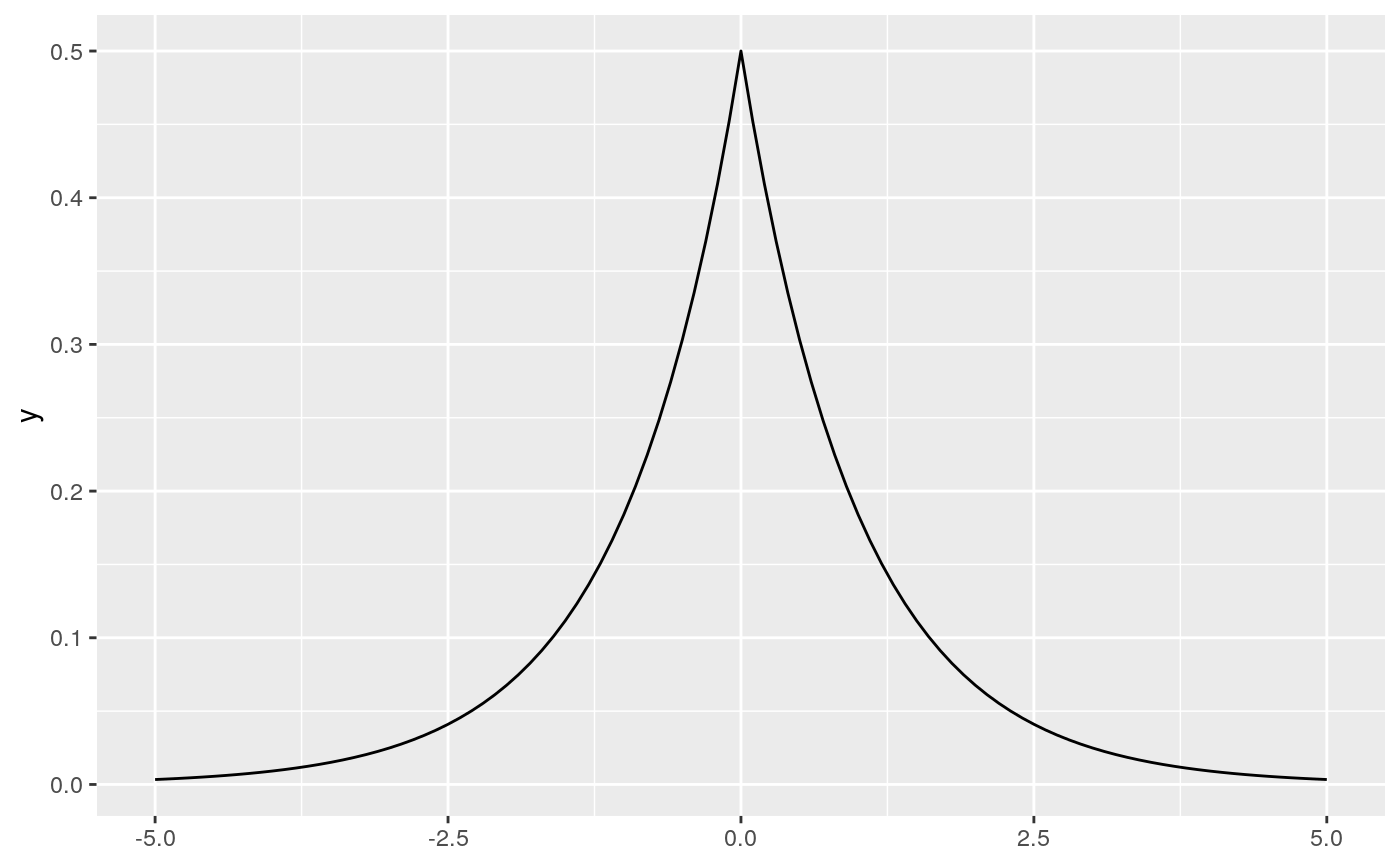
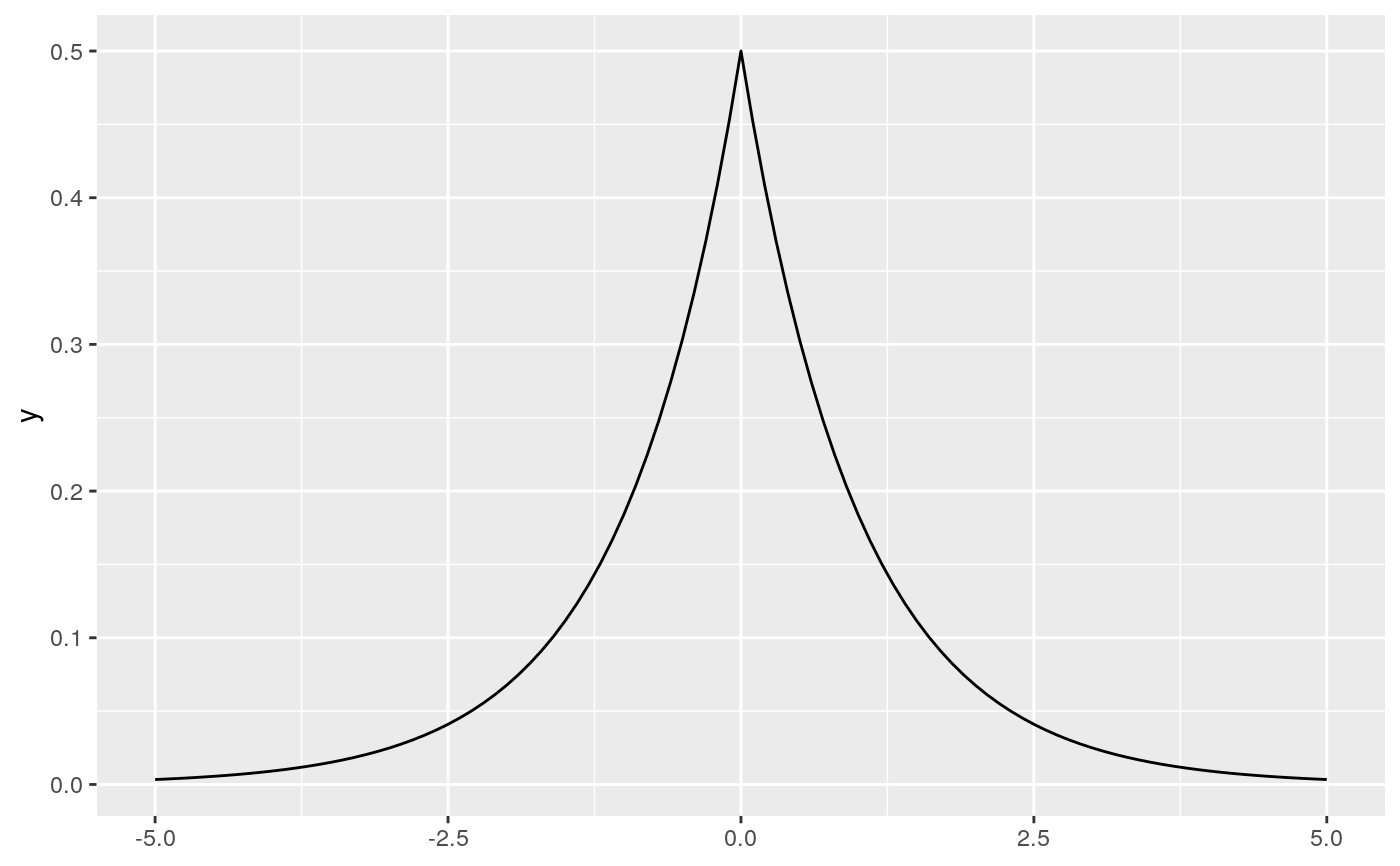
# geom_function() is useful for overlaying functions set.seed(1492) ggplot(data.frame(x = rnorm(100)), aes(x)) + geom_density() + geom_function(fun = dnorm, colour = "red")# To plot functions without data, specify range of x-axis base <- ggplot() + xlim(-5, 5) base + geom_function(fun = dnorm)# The underlying mechanics evaluate the function at discrete points # and connect the points with lines base + stat_function(fun = dnorm, geom = "point")base + stat_function(fun = dnorm, geom = "point", n = 20)base + geom_function(fun = dnorm, n = 20)# Two functions on the same plot base + geom_function(aes(colour = "normal"), fun = dnorm) + geom_function(aes(colour = "t, df = 1"), fun = dt, args = list(df = 1))
