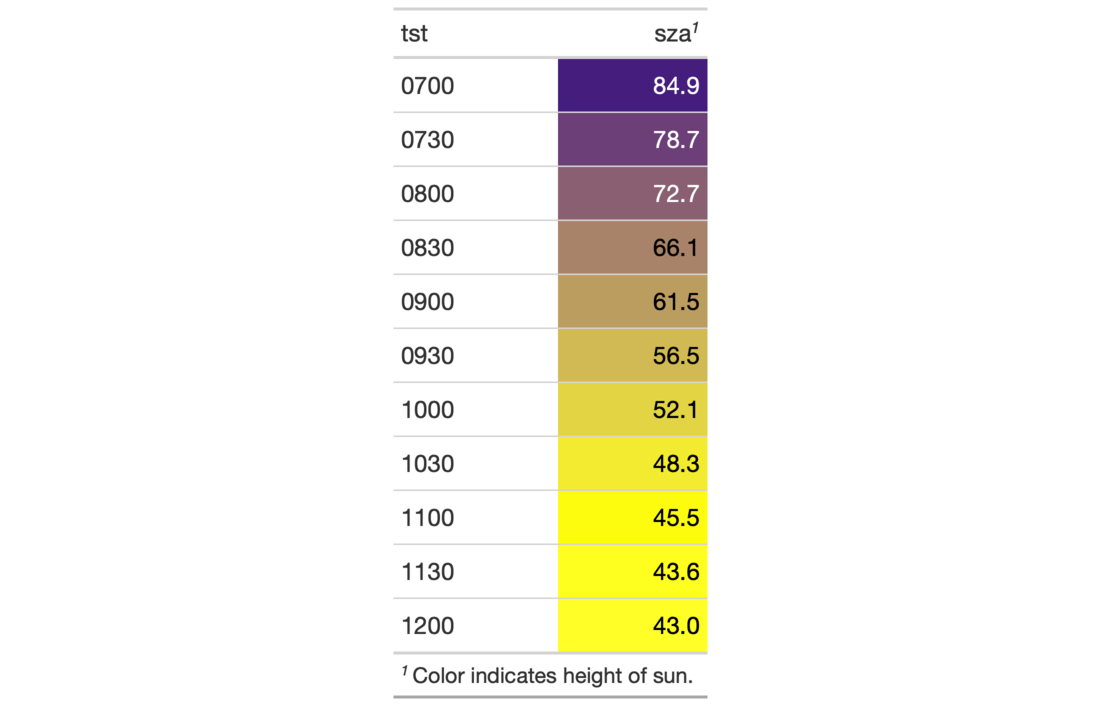
The tab_footnote() function can make it a painless process to add a
footnote to a gt table. There are two components to a footnote: (1) a
footnote mark that is attached to the targeted cell text, and (2) the
footnote text (that starts with the corresponding footnote mark) that is
placed in the table's footer area. Each call of tab_footnote() will add a
different note, and one or more cells can be targeted via the location helper
functions (e.g., cells_body(), cells_column_labels(), etc.).
tab_footnote(data, footnote, locations)
Arguments
| data | A table object that is created using the |
|---|---|
| footnote | The text to be used in the footnote. We can optionally use
the |
| locations | The cell or set of cells to be associated with the footnote.
Supplying any of the |
Value
An object of class gt_tbl.
Details
The formatting of the footnotes can be controlled through the use of various
parameters in the tab_options() function:
footnotes.sep: allows for a choice of the separator between consecutive footnotes in the table footer. By default, this is set to a linebreak.footnotes.marks: the set of sequential characters or numbers used to identify the footnotes.footnotes.font.size: the size of the font used in the footnote section.footnotes.padding: the amount of padding to apply between the footnote and source note sections in the table footer.
Figures

Function ID
2-6
See also
Other Create or Modify Parts:
tab_header(),
tab_options(),
tab_row_group(),
tab_source_note(),
tab_spanner_delim(),
tab_spanner(),
tab_stubhead(),
tab_style()
Examples
# Use `sza` to create a gt table; color
# the `sza` column using the `data_color()`
# function, then, add a footnote to the
# `sza` column label explaining what the
# color scale signifies
tab_1 <-
  sza %>%
  dplyr::filter(
    latitude == 20 &
      month == "jan" &
      !is.na(sza)
  ) %>%
  dplyr::select(-latitude, -month) %>%
  gt() %>%
  data_color(
    columns = sza,
    colors = scales::col_numeric(
      palette = c("white", "yellow", "navyblue"),
      domain = c(0, 90)
    )
  ) %>%
  tab_footnote(
    footnote = "Color indicates height of sun.",
    locations = cells_column_labels(
      columns = sza
    )
  )