With the tab_style() function we can target specific cells and apply styles
to them. This is best done in conjunction with the helper functions
cell_text(), cell_fill(), and cell_borders(). At present this function
is focused on the application of styles for HTML output only (as such, other
output formats will ignore all tab_style() calls). Using the aforementioned
helper functions, here are some of the styles we can apply:
the background color of the cell (
cell_fill():color)the cell's text color, font, and size (
cell_text():color,font,size)the text style (
cell_text():style), enabling the use of italics or oblique text.the text weight (
cell_text():weight), allowing the use of thin to bold text (the degree of choice is greater with variable fonts)the alignment and indentation of text (
cell_text():alignandindent)the cell borders (
cell_borders())
tab_style(data, style, locations)
Arguments
| data | A table object that is created using the |
|---|---|
| style | a vector of styles to use. The |
| locations | the cell or set of cells to be associated with the style.
Supplying any of the |
Value
An object of class gt_tbl.
Figures

Function ID
2-8
See also
cell_text(), cell_fill(), and cell_borders() as helpers for
defining custom styles and cells_body() as one of many useful helper
functions for targeting the locations to be styled.
Other Create or Modify Parts:
tab_footnote(),
tab_header(),
tab_options(),
tab_row_group(),
tab_source_note(),
tab_spanner_delim(),
tab_spanner(),
tab_stubhead()
Examples
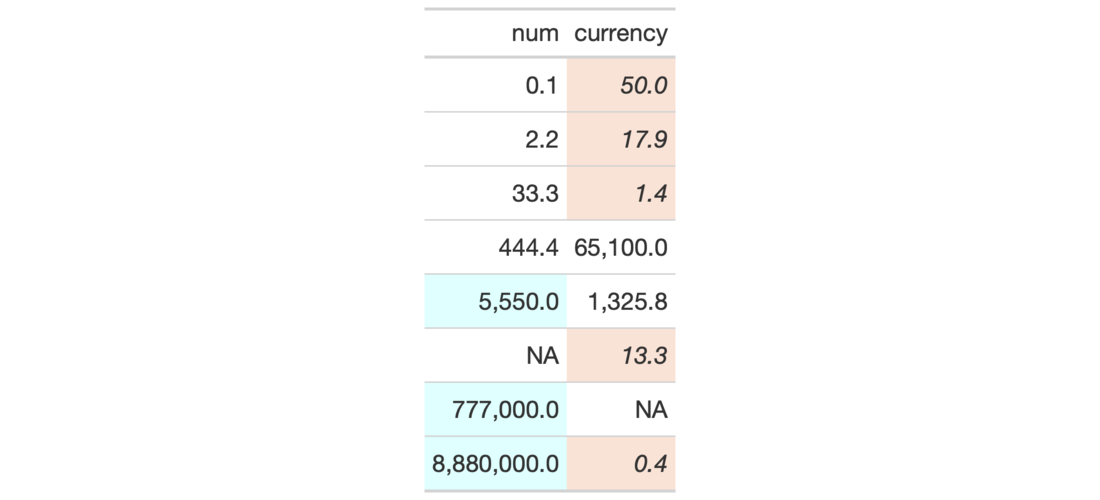
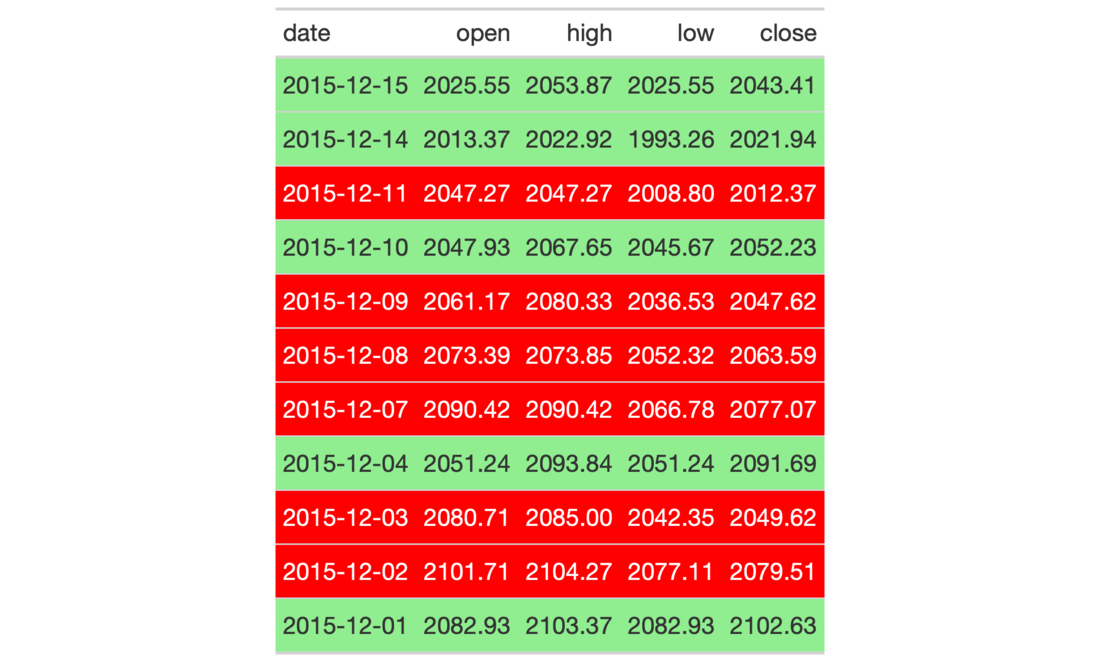
# Use `exibble` to create a gt table;
# add styles that are to be applied
# to data cells that satisfy a
# condition (using `tab_style()`)
tab_1 <-
  exibble %>%
  dplyr::select(num, currency) %>%
  gt() %>%
  fmt_number(
    columns = c(num, currency),
    decimals = 1
  ) %>%
  tab_style(
    style = list(
      cell_fill(color = "lightcyan"),
      cell_text(weight = "bold")
      ),
    locations = cells_body(
      columns = num,
      rows = num >= 5000
    )
  ) %>%
  tab_style(
    style = list(
      cell_fill(color = "#F9E3D6"),
      cell_text(style = "italic")
      ),
    locations = cells_body(
      columns = currency,
      rows = currency < 100
    )
  )

# Use `sp500` to create a gt table;
# color entire rows of cells based
# on values in a particular column
tab_2 <-
  sp500 %>%
  dplyr::filter(
    date >= "2015-12-01" &
    date <= "2015-12-15"
  ) %>%
  dplyr::select(-c(adj_close, volume)) %>%
  gt() %>%
  tab_style(
    style = cell_fill(color = "lightgreen"),
    locations = cells_body(
      rows = close > open)
  ) %>%
  tab_style(
    style = list(
      cell_fill(color = "red"),
      cell_text(color = "white")
      ),
    locations = cells_body(
      rows = open > close)
  )

# Use `exibble` to create a gt table;
# replace missing values with the
# `fmt_missing()` function and then
# add styling to the `char` column
# with `cell_fill()` and with a
# CSS style declaration
tab_3 <-
  exibble %>%
  dplyr::select(char, fctr) %>%
  gt() %>%
  fmt_missing(everything()) %>%
  tab_style(
    style = list(
      cell_fill(color = "lightcyan"),
      "font-variant: small-caps;"
    ),
    locations = cells_body(columns = char)
  )