Formatter for p-values, using "<" and ">" for p-values close to 0 and 1.
label_pvalue(accuracy = 0.001, decimal.mark = ".", prefix = NULL,
  add_p = FALSE)

pvalue_format(accuracy = 0.001, decimal.mark = ".", prefix = NULL,
  add_p = FALSE)

pvalue(x, accuracy = 0.001, decimal.mark = ".", prefix = NULL,
  add_p = FALSE)
Arguments
| accuracy | A number to round to. Use (e.g.) Applied to rescaled data. |
|---|---|
| decimal.mark | The character to be used to indicate the numeric decimal point. |
| prefix | A character vector of length 3 giving the prefixes to
put in front of numbers. The default values are |
| add_p | Add "p=" before the value? |
| x | A numeric vector to format. |
Value
All label_() functions return a "labelling" function, i.e. a function that
takes a vector x and returns a character vector of length(x) giving a
label for each input value.
Labelling functions are designed to be used with the labels argument of
ggplot2 scales. The examples demonstrate their use with x scales, but
they work similarly for all scales, including those that generate legends
rather than axes.
Old interface
pvalue() and pvalue_dollar() are retired; please use label_pvalue()
instead.
See also
Other labels for continuous scales: label_bytes,
label_dollar,
label_number_auto,
label_number_si,
label_ordinal, label_parse,
label_percent,
label_scientific
Examples
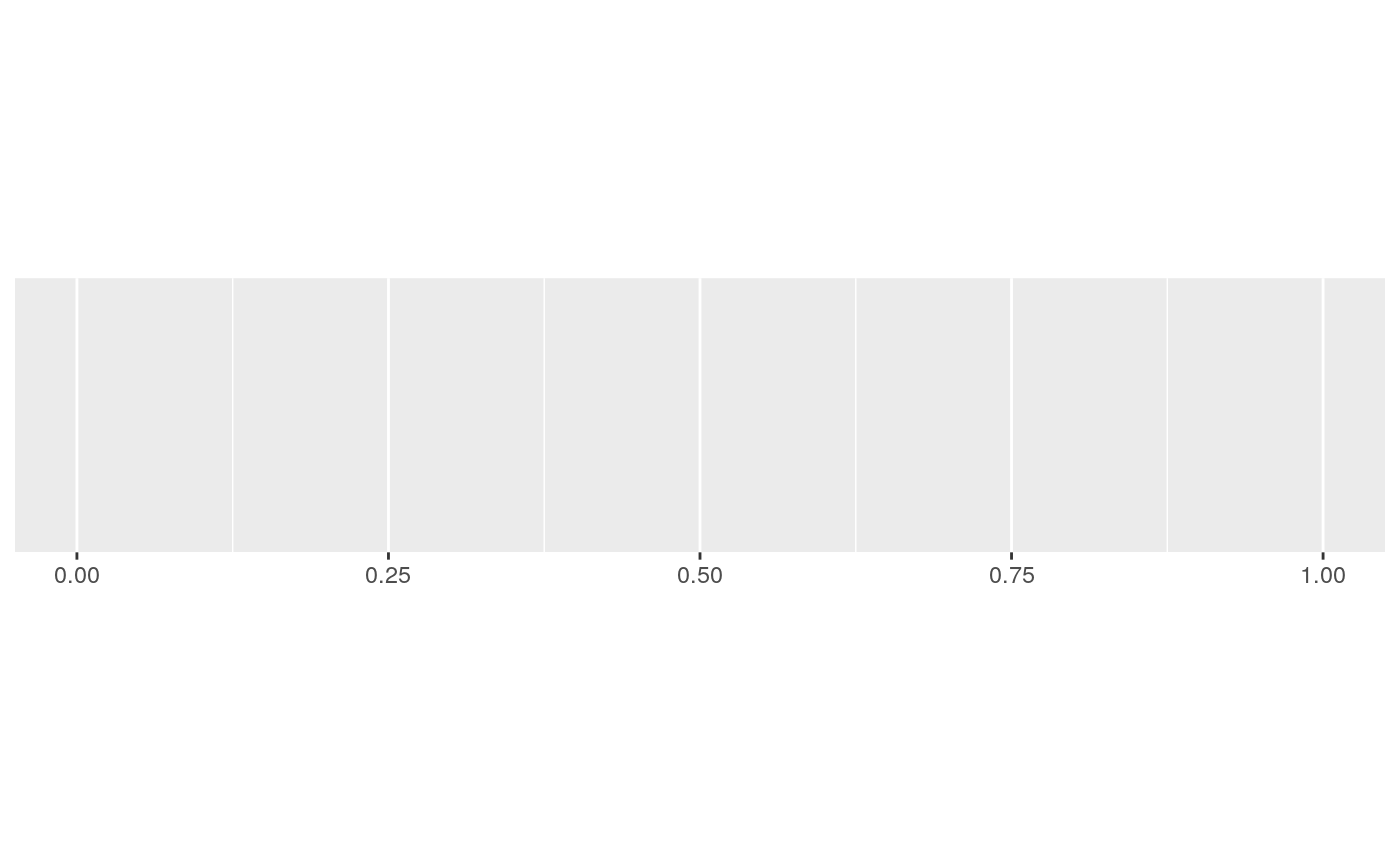
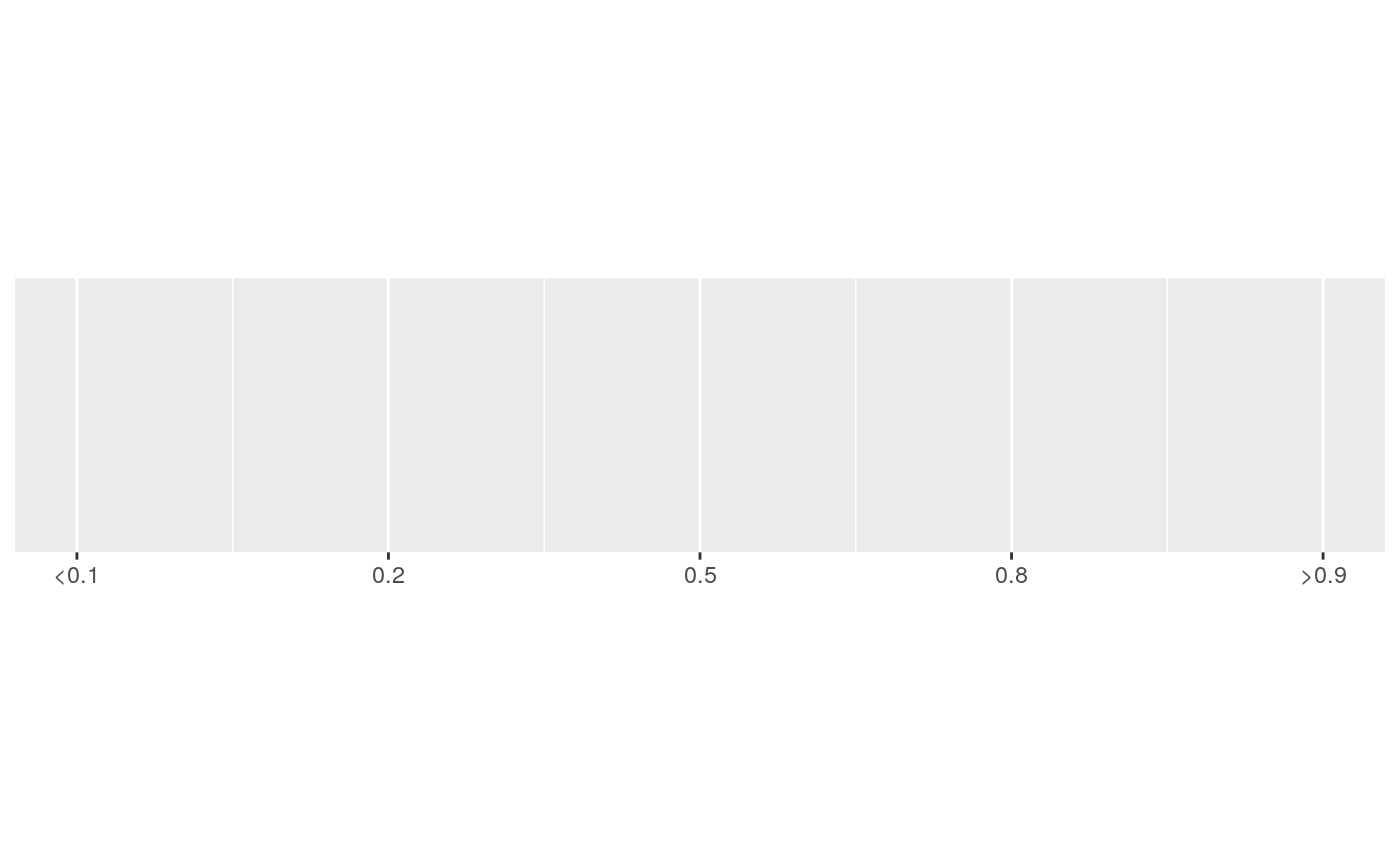
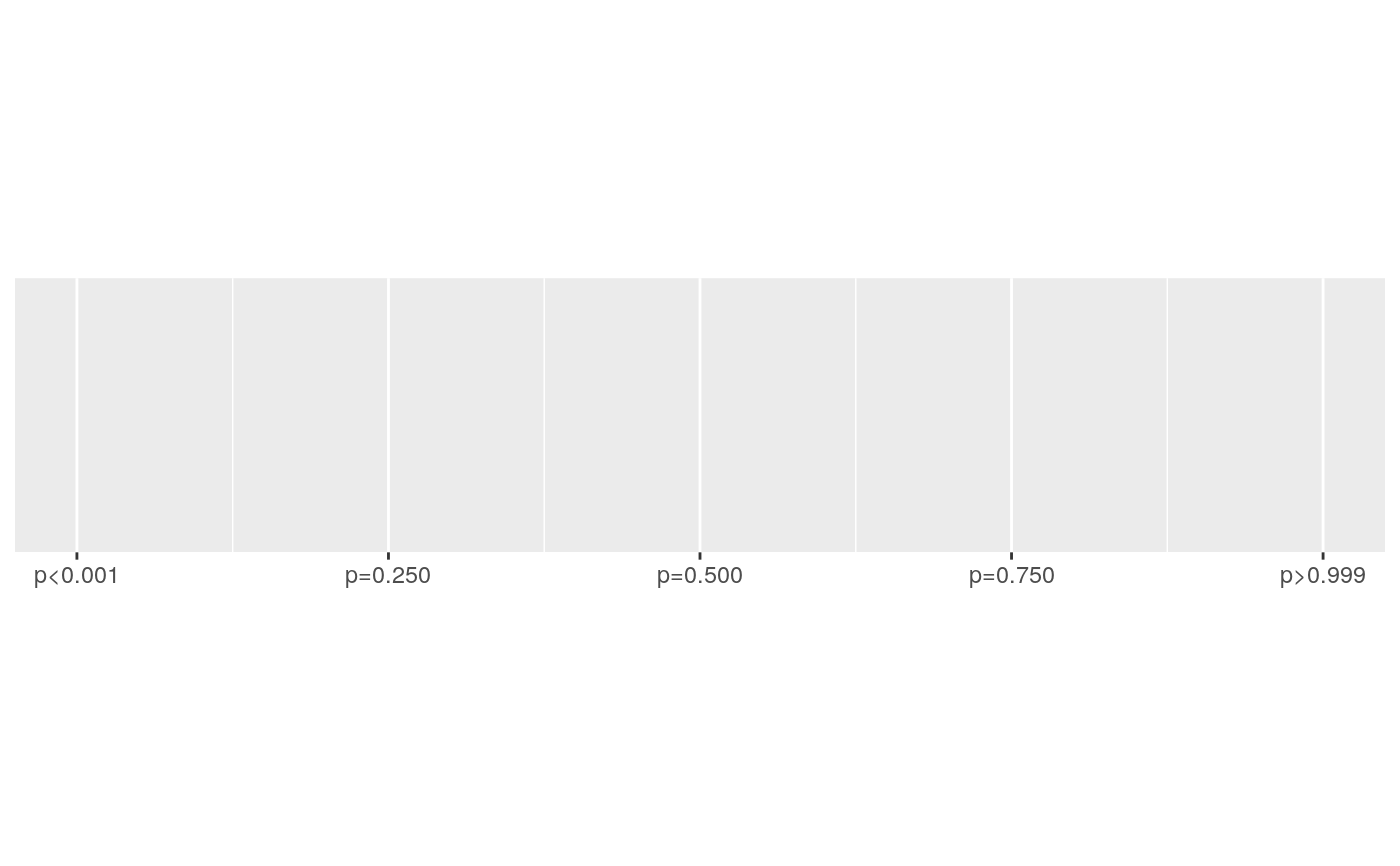
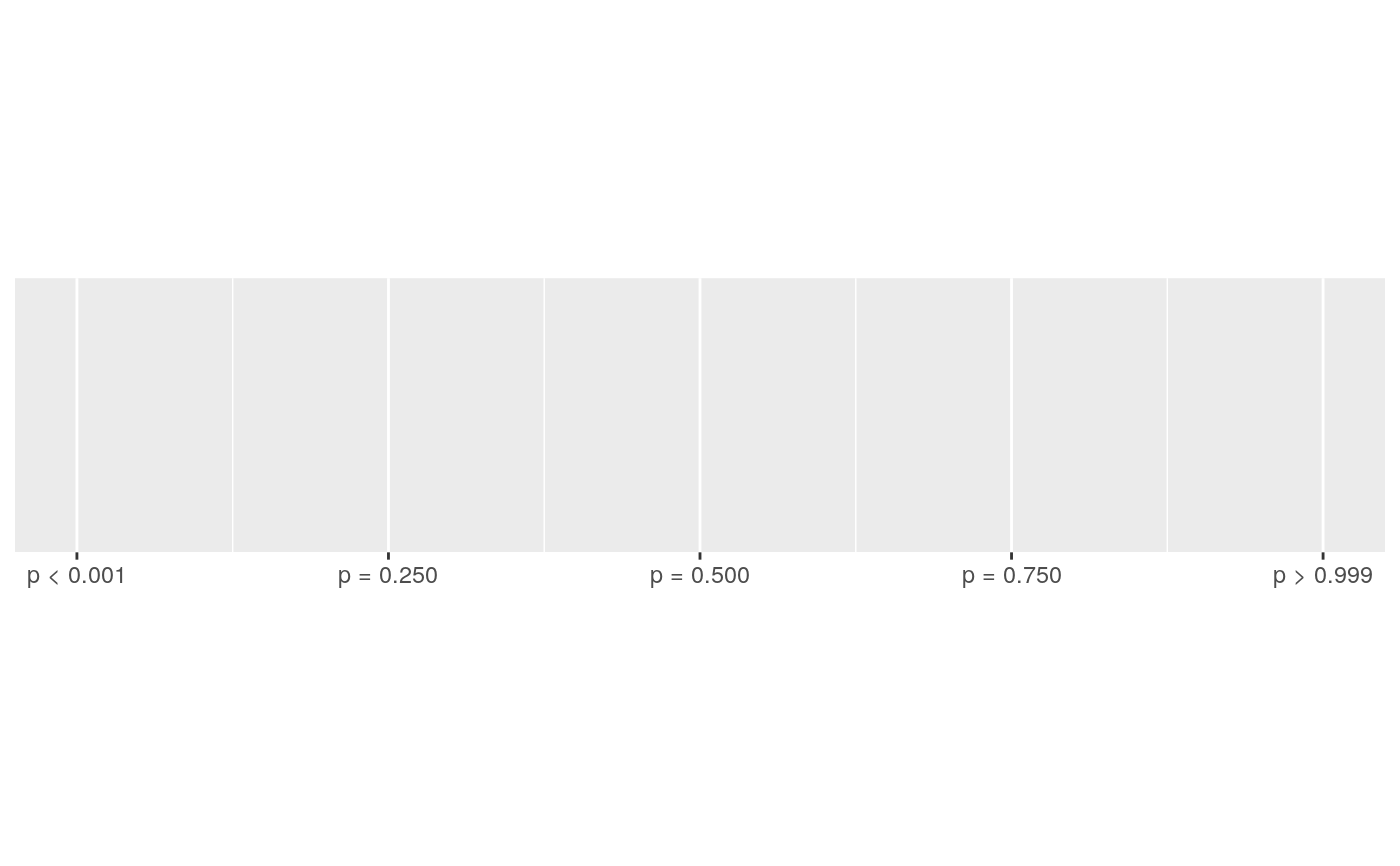
#> scale_x_continuous()#> scale_x_continuous(labels = label_pvalue())#> scale_x_continuous(labels = label_pvalue(accuracy = 0.1))#> scale_x_continuous(labels = label_pvalue(add_p = TRUE))# Or provide your own prefixes prefix <- c("p < ", "p = ", "p > ") demo_continuous(c(0, 1), labels = label_pvalue(prefix = prefix))#> scale_x_continuous(labels = label_pvalue(prefix = prefix))