Label percentages (2.5%, 50%, etc)
label_percent(
  accuracy = NULL,
  scale = 100,
  prefix = "",
  suffix = "%",
  big.mark = " ",
  decimal.mark = ".",
  trim = TRUE,
  ...
)
Arguments
- accuracy
A number to round to. Use (e.g.)
0.01to show 2 decimal places of precision. IfNULL, the default, uses a heuristic that should ensure breaks have the minimum number of digits needed to show the difference between adjacent values.Applied to rescaled data.
- scale
A scaling factor:
xwill be multiplied byscalebefore formatting. This is useful if the underlying data is very small or very large.- prefix
Additional text to display before the number. The suffix is applied to absolute value before
style_positiveandstyle_negativeare processed so thatprefix = "$"will yield (e.g.)-$1and($1).- suffix
Additional text to display after the number.
- big.mark
Character used between every 3 digits to separate thousands.
- decimal.mark
The character to be used to indicate the numeric decimal point.
- trim
Logical, if
FALSE, values are right-justified to a common width (seebase::format()).- ...
Other arguments passed on to
base::format().
Value
All label_() functions return a "labelling" function, i.e. a function that
takes a vector x and returns a character vector of length(x) giving a
label for each input value.
Labelling functions are designed to be used with the labels argument of
ggplot2 scales. The examples demonstrate their use with x scales, but
they work similarly for all scales, including those that generate legends
rather than axes.
See also
Other labels for continuous scales:
label_bytes(),
label_dollar(),
label_number_auto(),
label_number_si(),
label_ordinal(),
label_parse(),
label_pvalue(),
label_scientific()
Examples
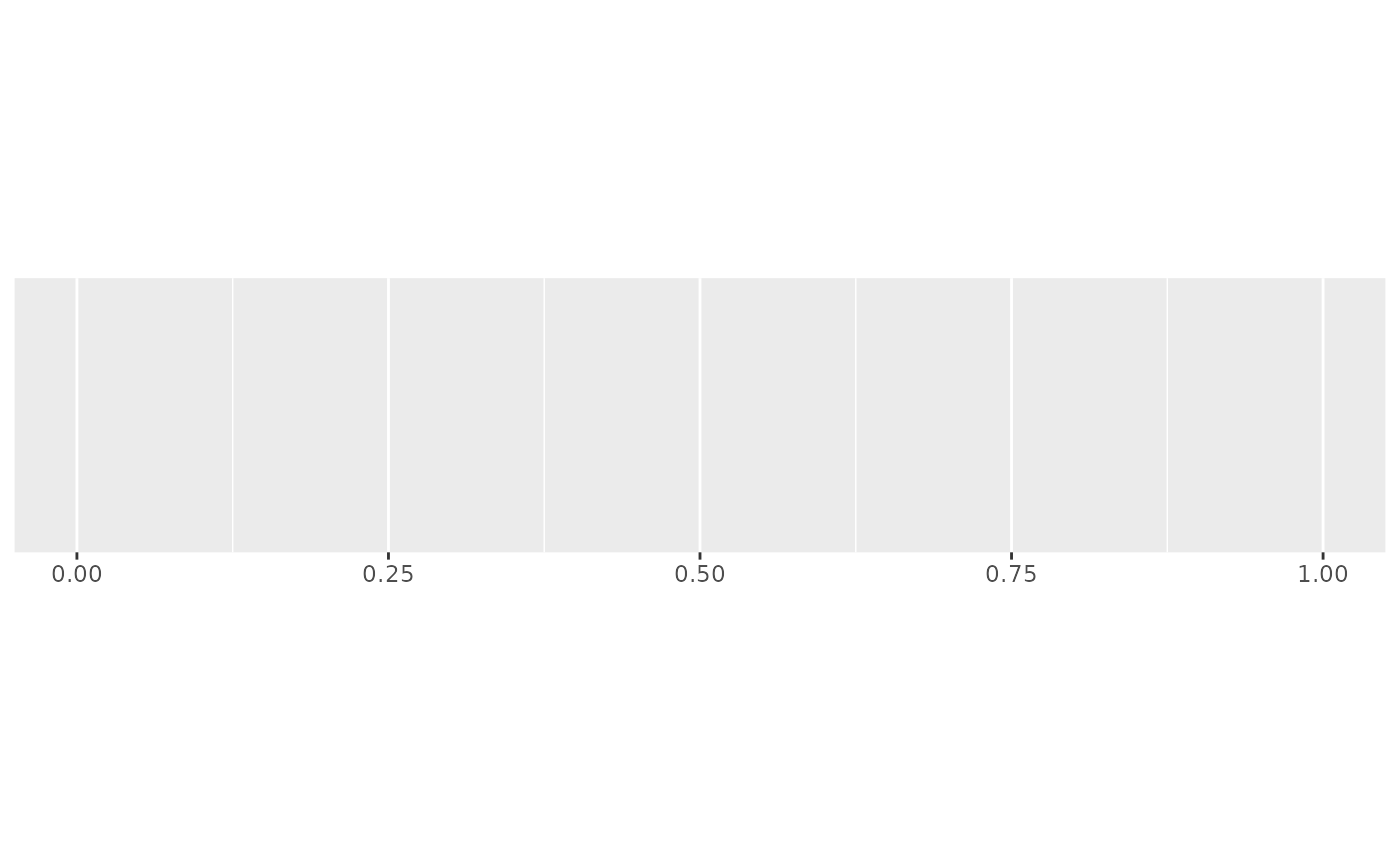
demo_continuous(c(0, 1))
#> scale_x_continuous()
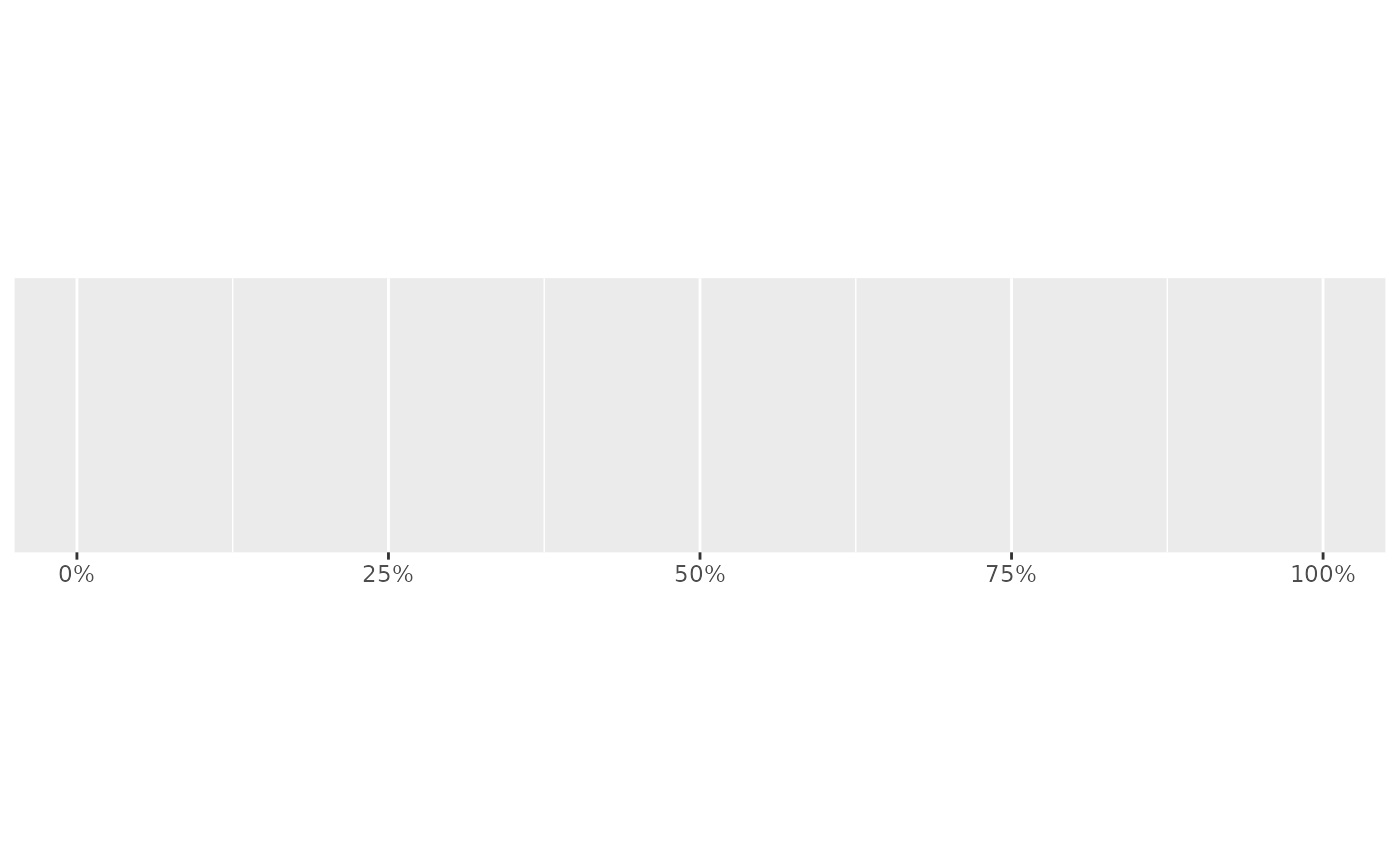
 demo_continuous(c(0, 1), labels = label_percent())
#> scale_x_continuous(labels = label_percent())
demo_continuous(c(0, 1), labels = label_percent())
#> scale_x_continuous(labels = label_percent())
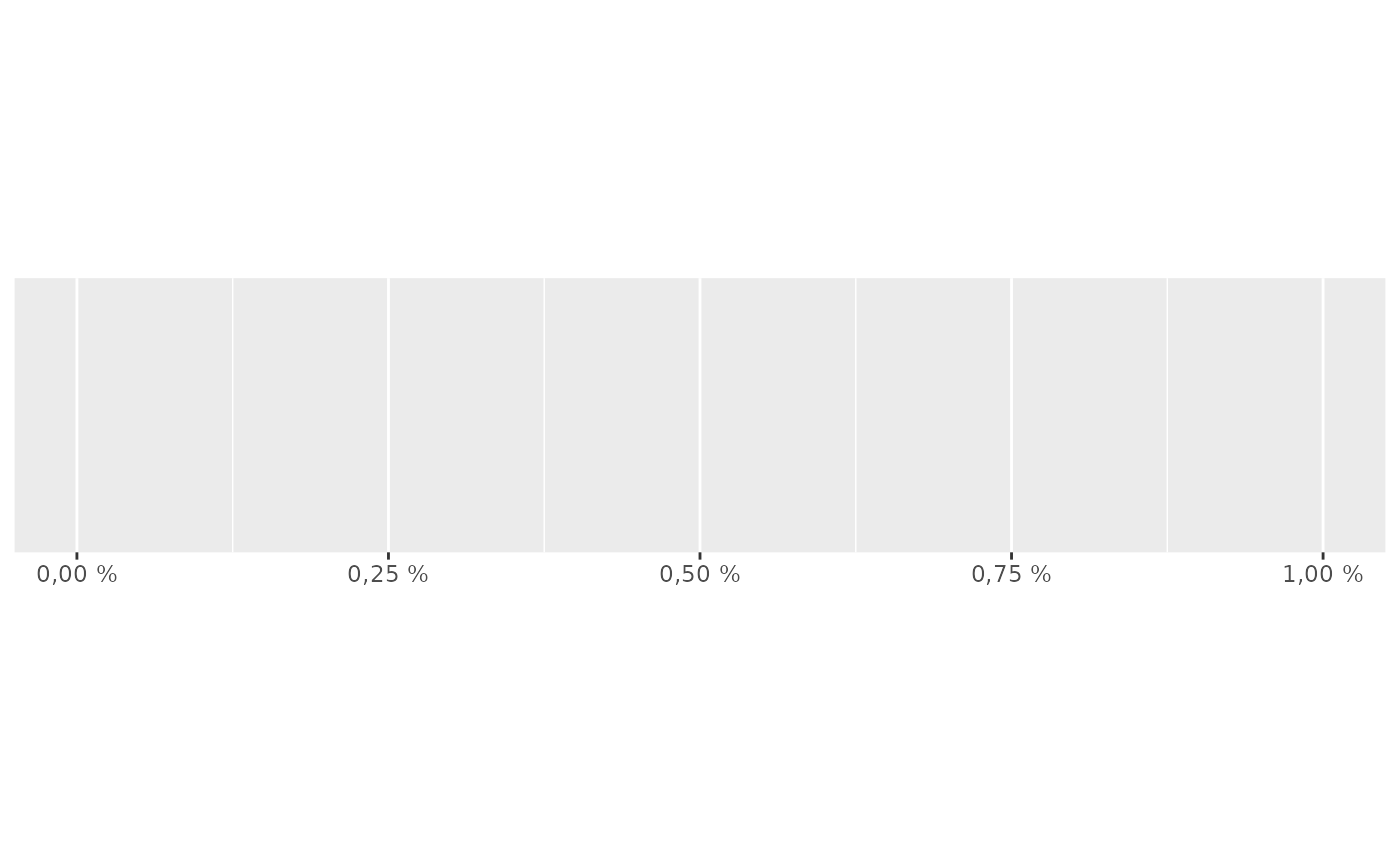
 # Use prefix and suffix to create your own variants
french_percent <- label_percent(
decimal.mark = ",",
suffix = " %"
)
demo_continuous(c(0, .01), labels = french_percent)
#> scale_x_continuous(labels = french_percent)
# Use prefix and suffix to create your own variants
french_percent <- label_percent(
decimal.mark = ",",
suffix = " %"
)
demo_continuous(c(0, .01), labels = french_percent)
#> scale_x_continuous(labels = french_percent)