Customizing Plots
Kyle Baron
2020-03-11
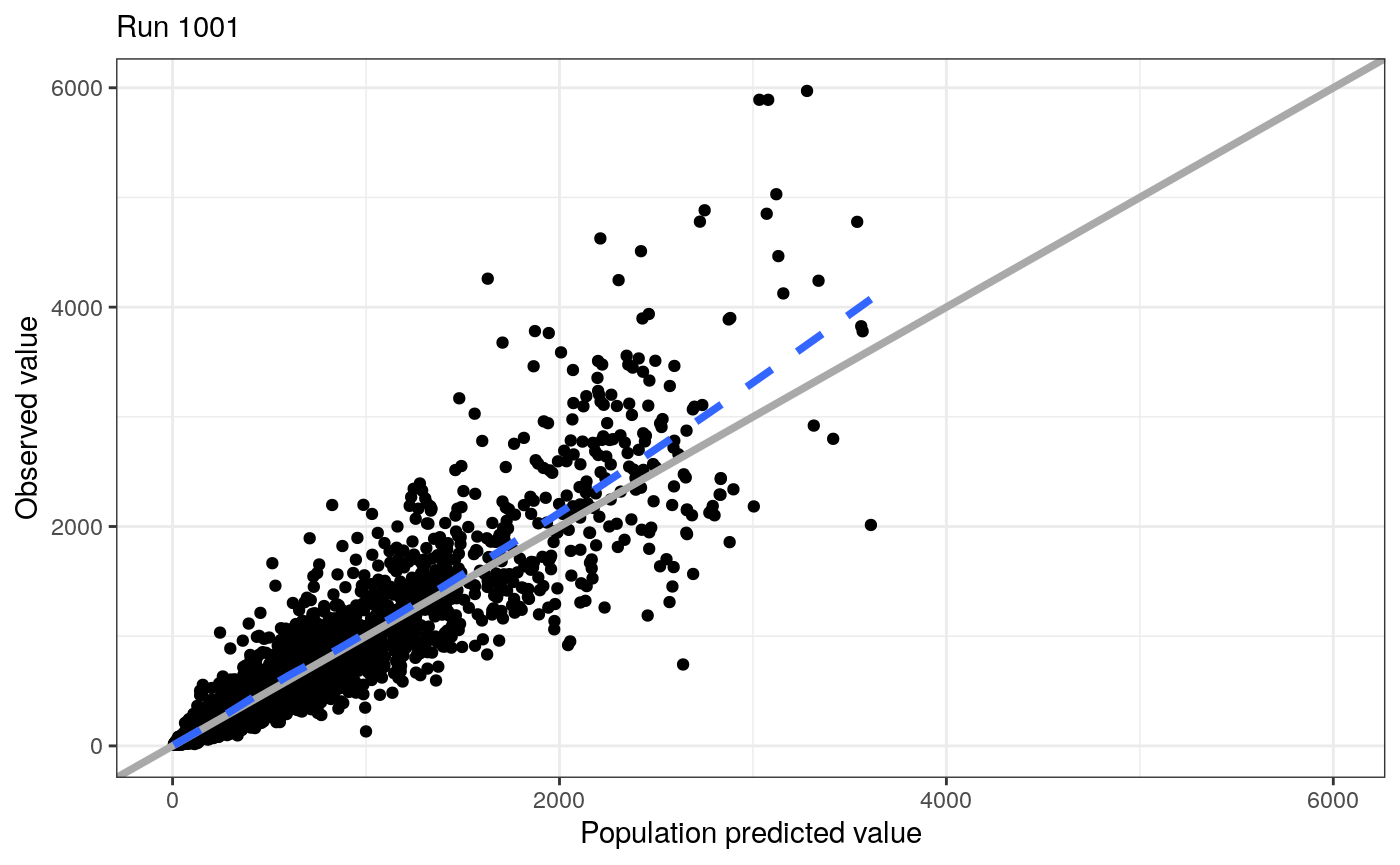
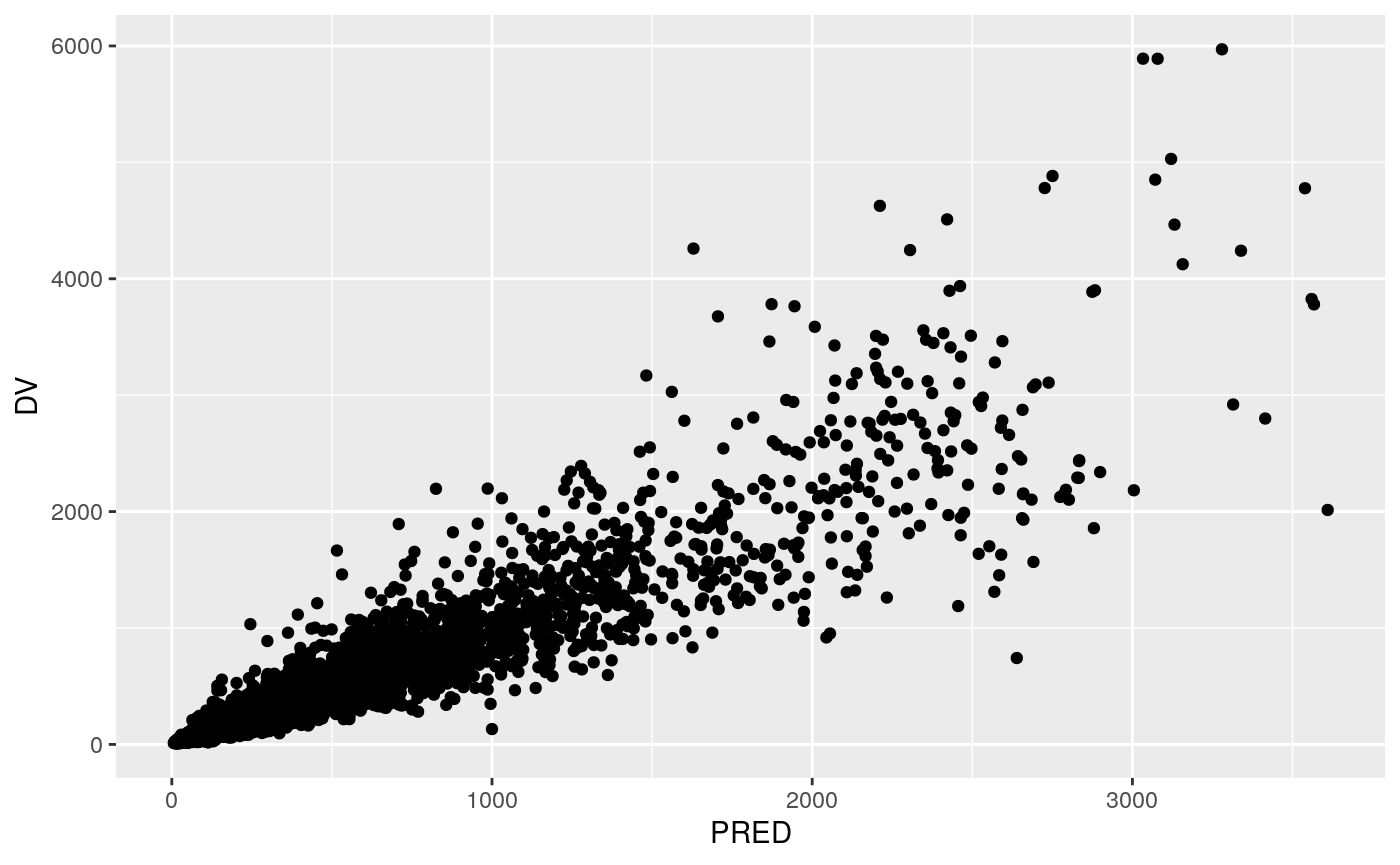
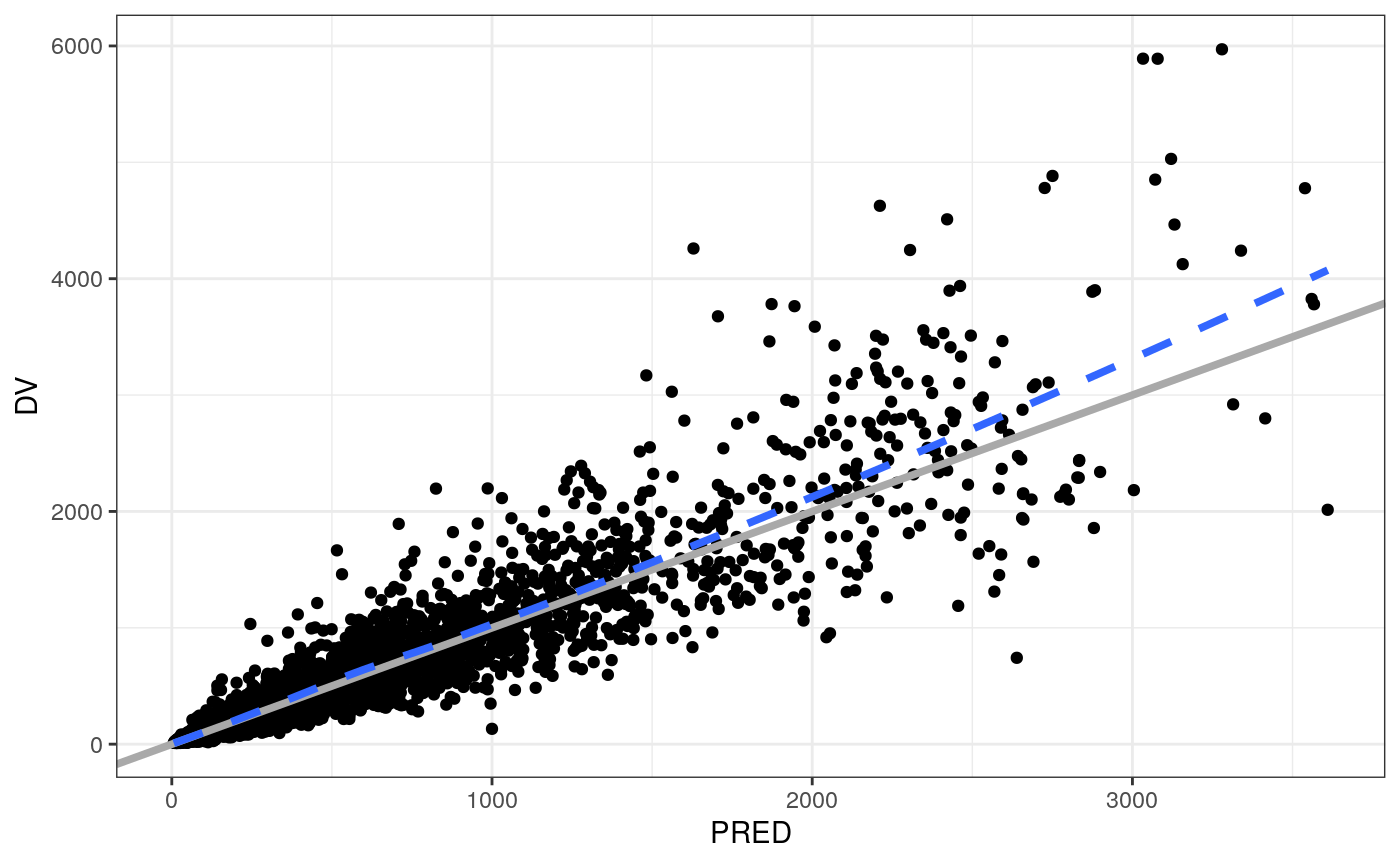
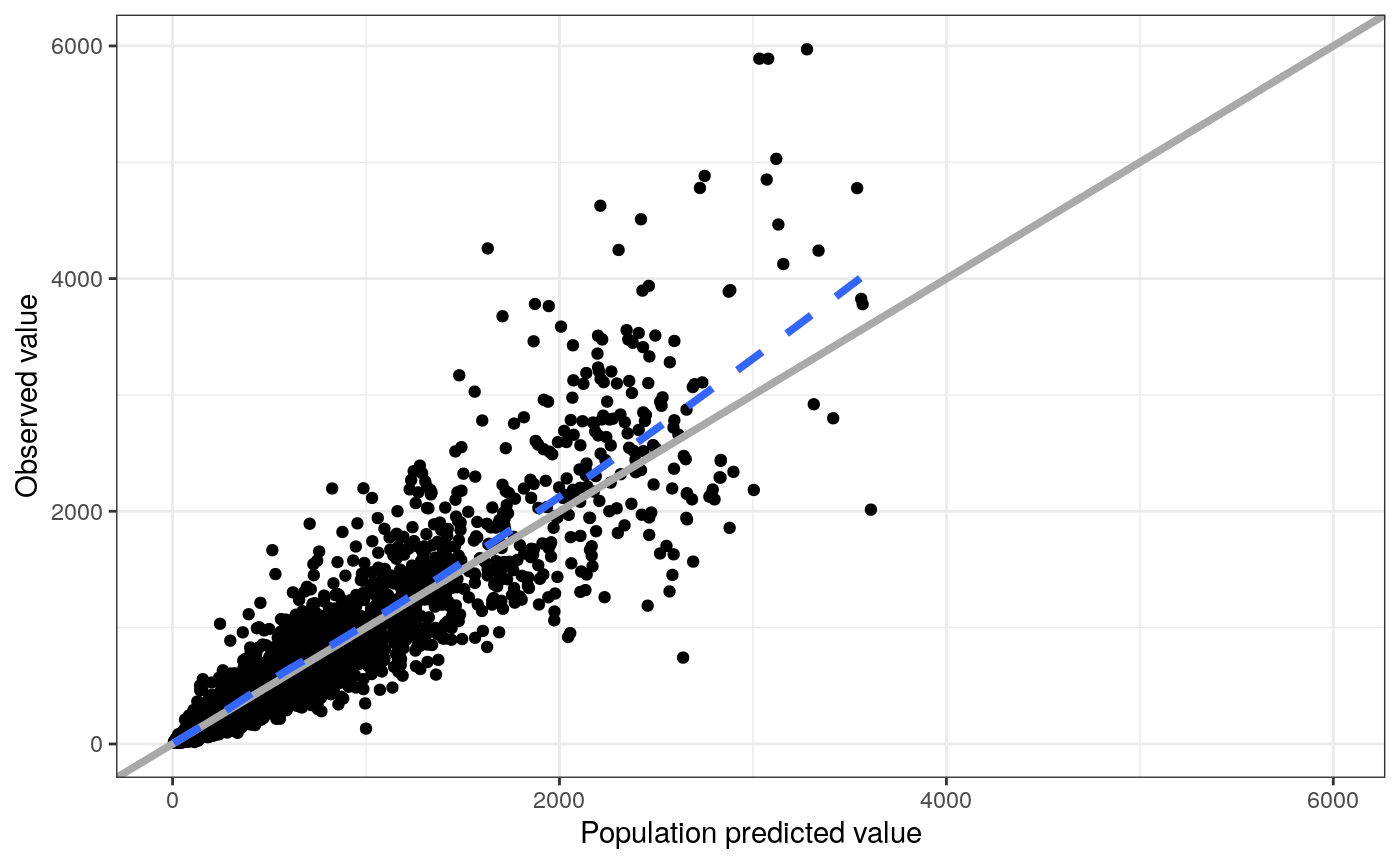
customize.RmdA default plot

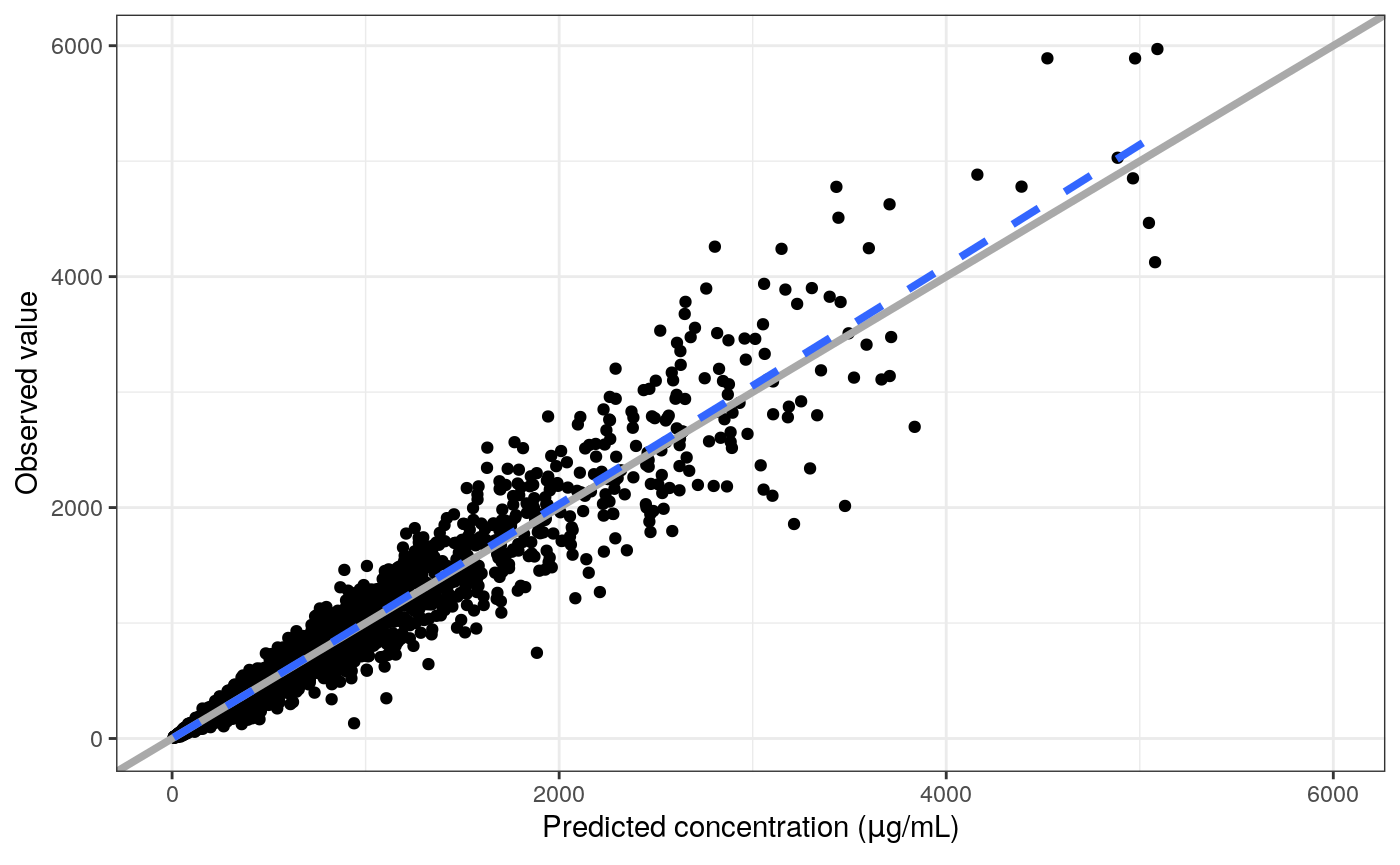
Add Greek symbols to an axis label
There are a couple of ways to do this. The easiest is to have the latex2exp package installed and write the TeX right in the label.
## Loading required namespace: latex2exp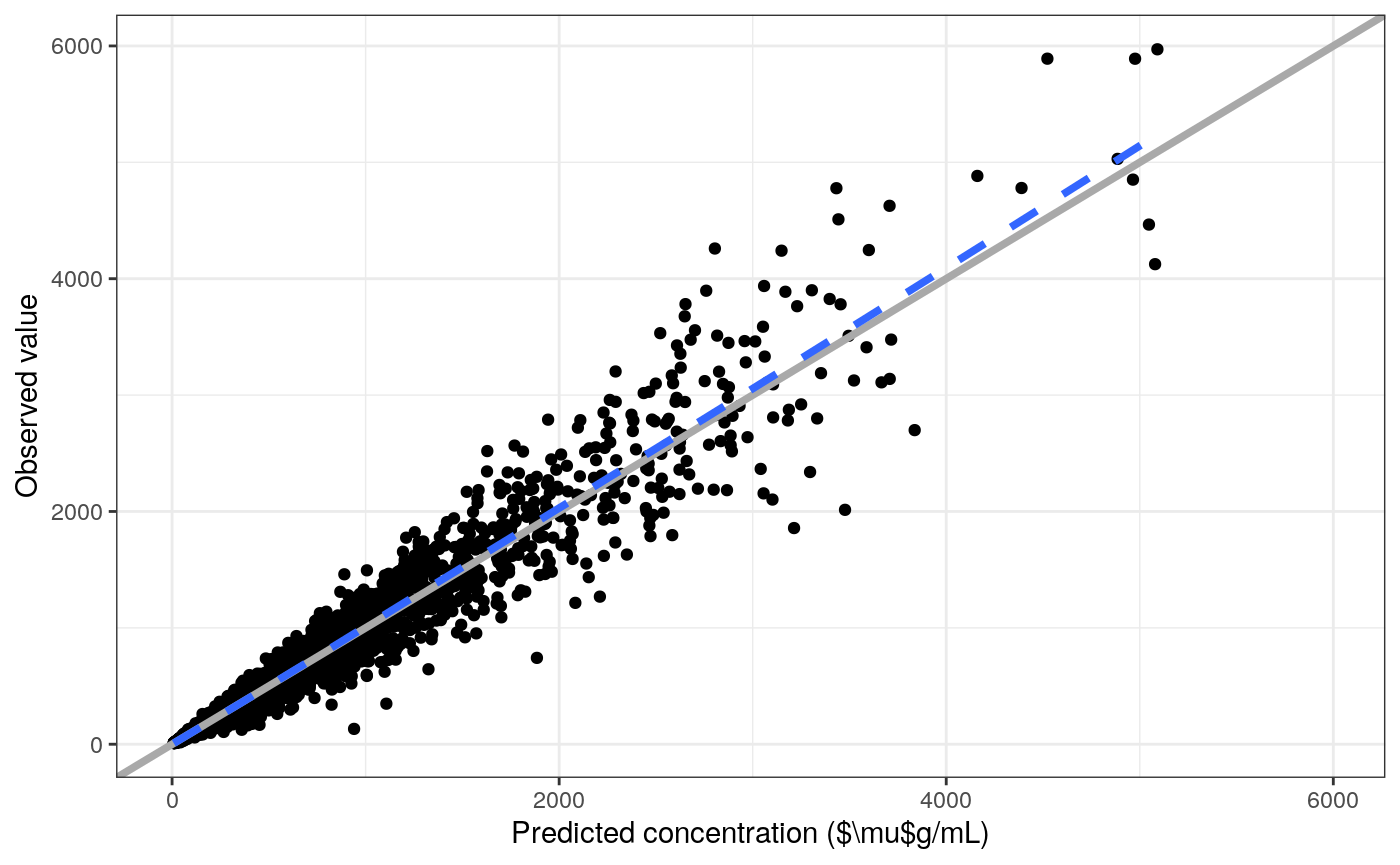
Otherwise, you can trigger R plotmath by putting !! at the start of the column label