Wrapped / Faceted Plots
Kyle Baron
2020-03-11
wrapped_plots.RmdRationale
For most applications, pmplots does not reshape your data frame; it works with what you pass in. However, for some applications, it is convenient to have a diagnostic plot that is faceted by a categorical variable in the data set. This vignette demostrates the faceted plots that are available. This faceting support is for a focused set of plots only. Users should generally either create facets own or use the split_plot function for other applications.
Plots
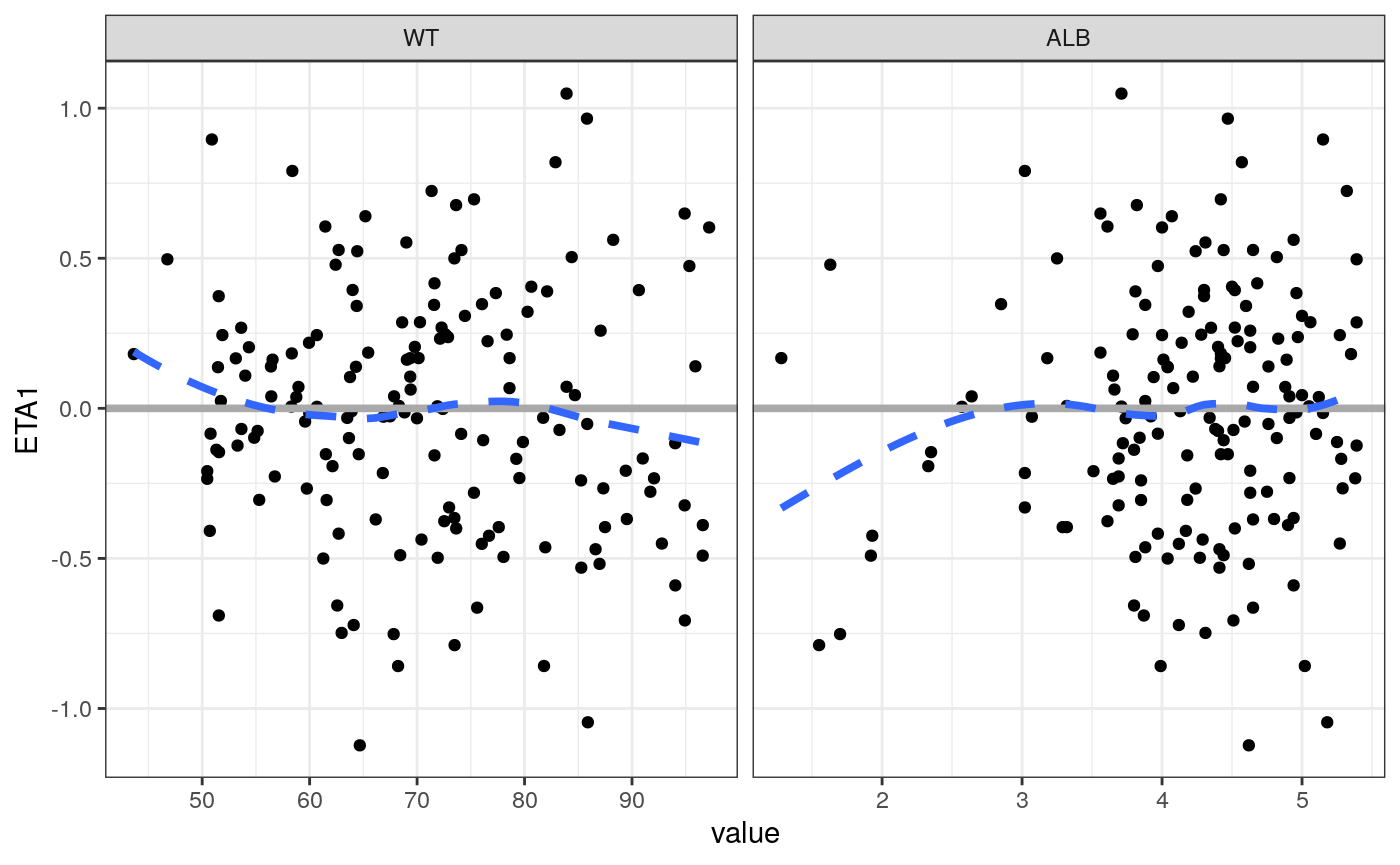
wrap_eta_cont
Here, enter a vector for the x argument
wrap_eta_cont(
  id,
  x = c("WT//WT (kg)", "BMI//BMI (kg/m2)", "ALB//ALB (g/dL)"),
  y = "ETA1//ETA-CL",
  scales="free_x",
  use_labels=TRUE
)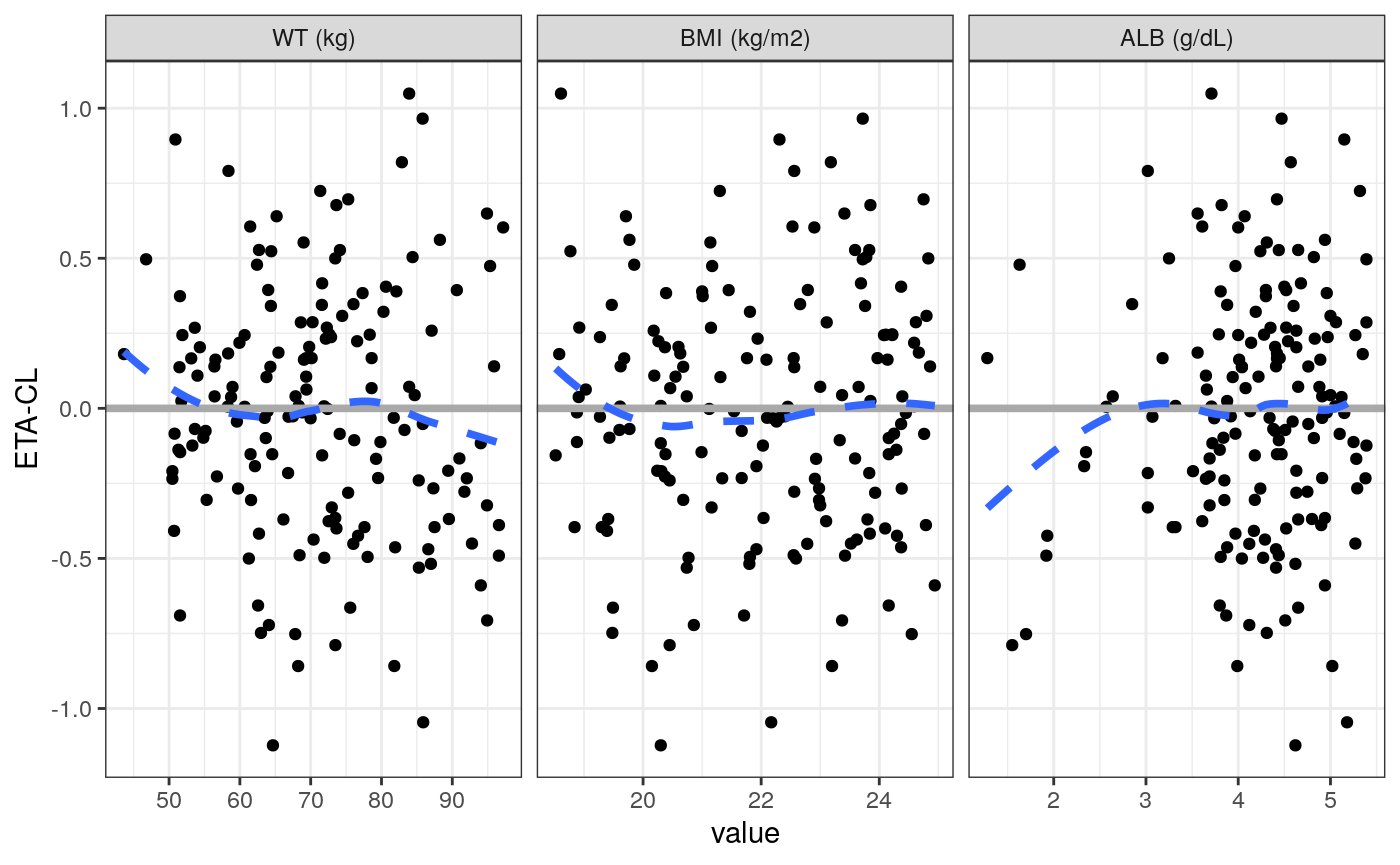
In this example, we enter labels along with column names and request that the labels be used for the shingle.
We can facet on x or y