Vectorized Plots
Kyle Baron
2020-03-11
list_plots.RmdVectorized plots
Some pmplots functions have been vectorized so that you can pass in a vector of inputs and get a list of plots back. This is a convenience feature that allows you to quickly make several plots. The intended use is to arrange those plots in a single page or multiple pages for display.
For example, we can plot WRES versus WT

If we wanted to vectorize this plot and look at WRES versus WT, ALB, CRCL, and AST we would write
## [[1]]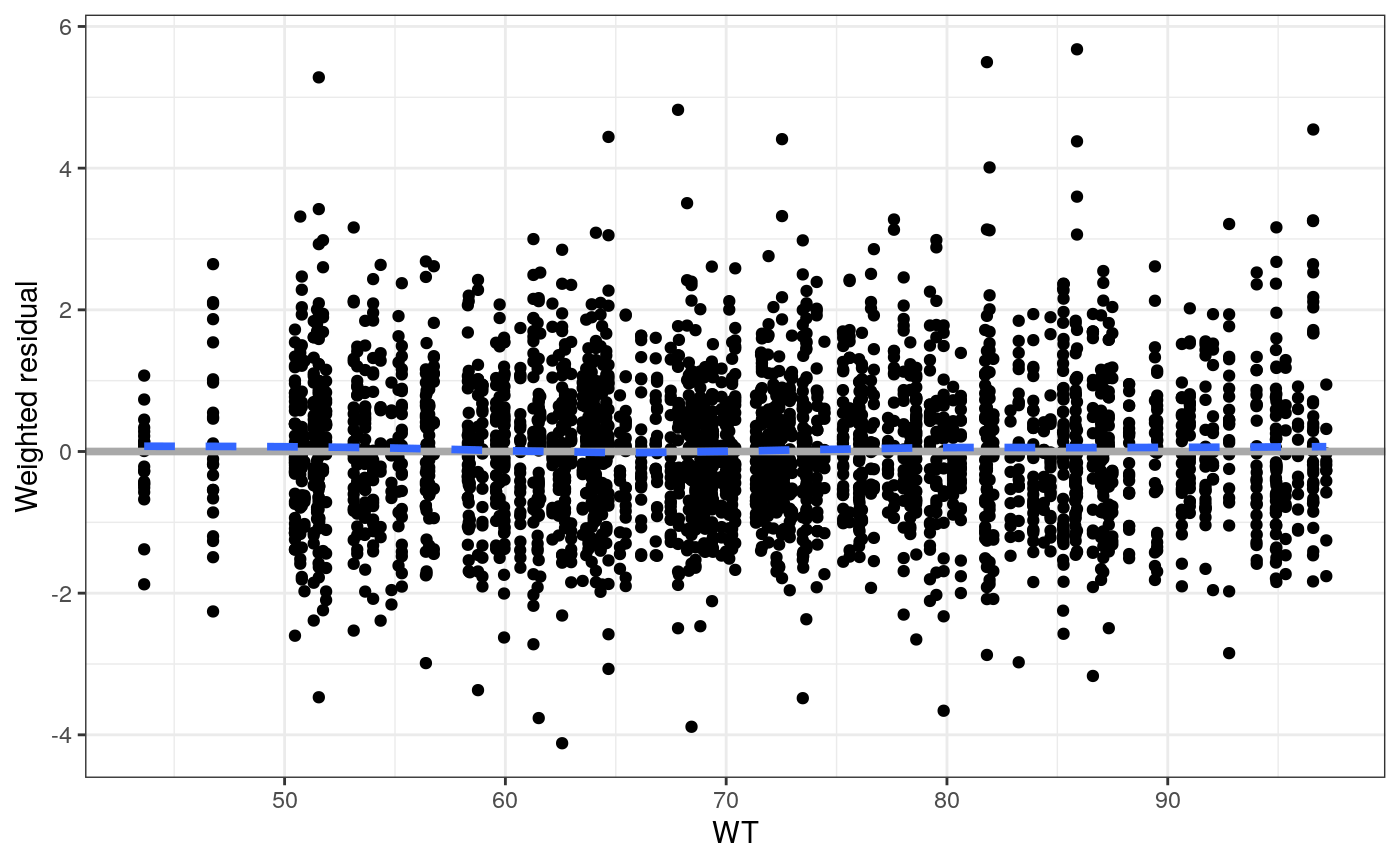
##
## [[2]]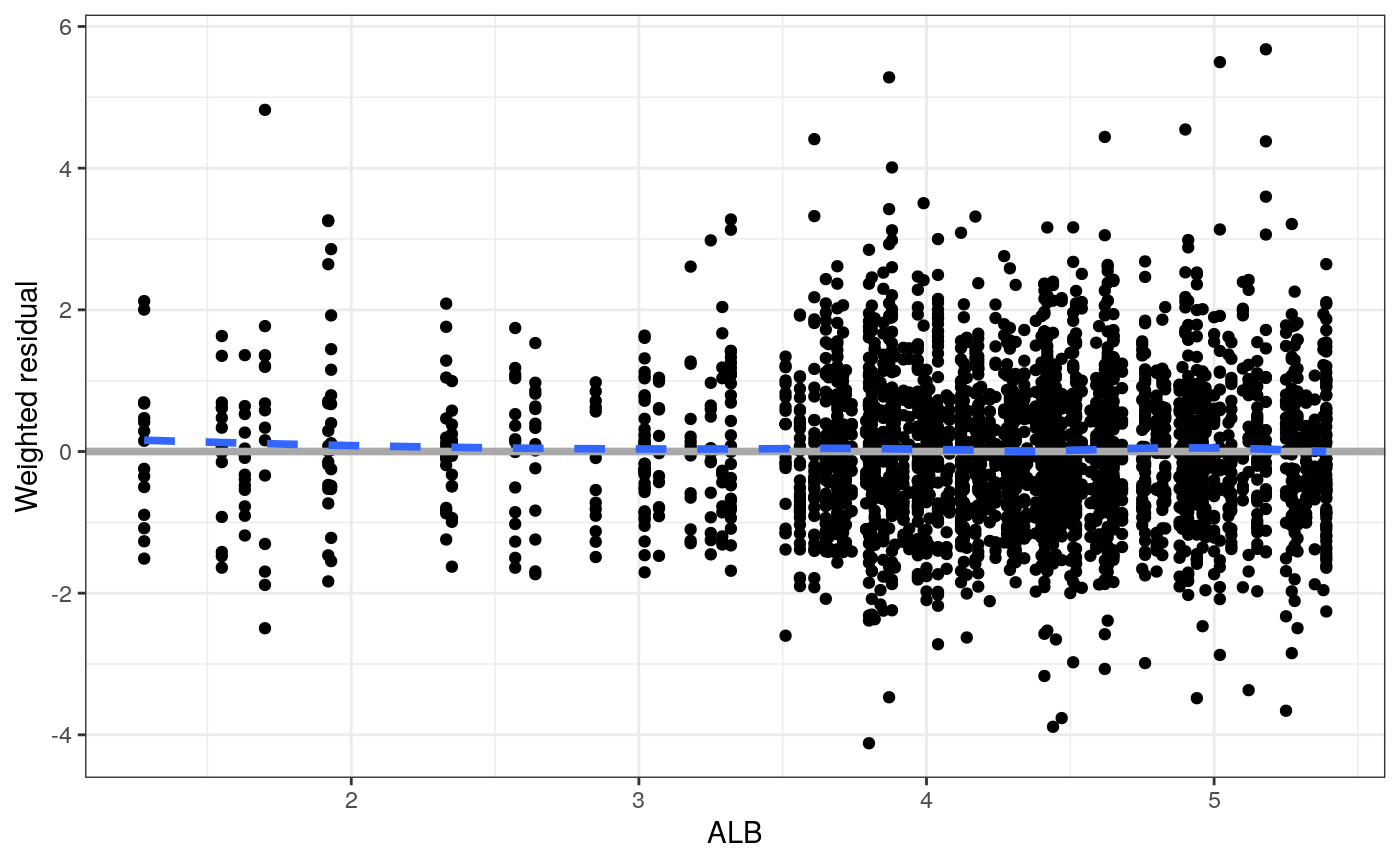
##
## [[3]]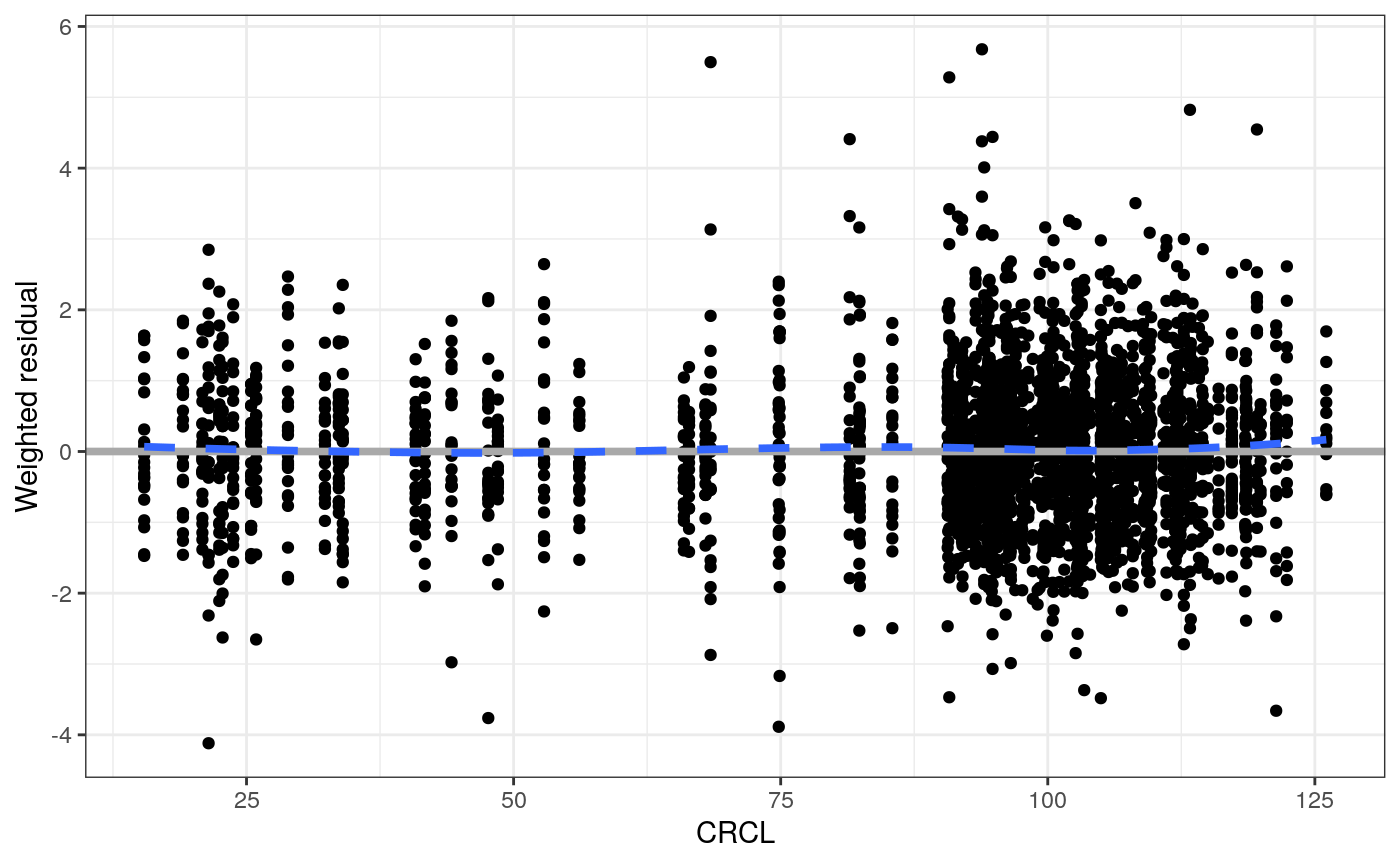
##
## [[4]]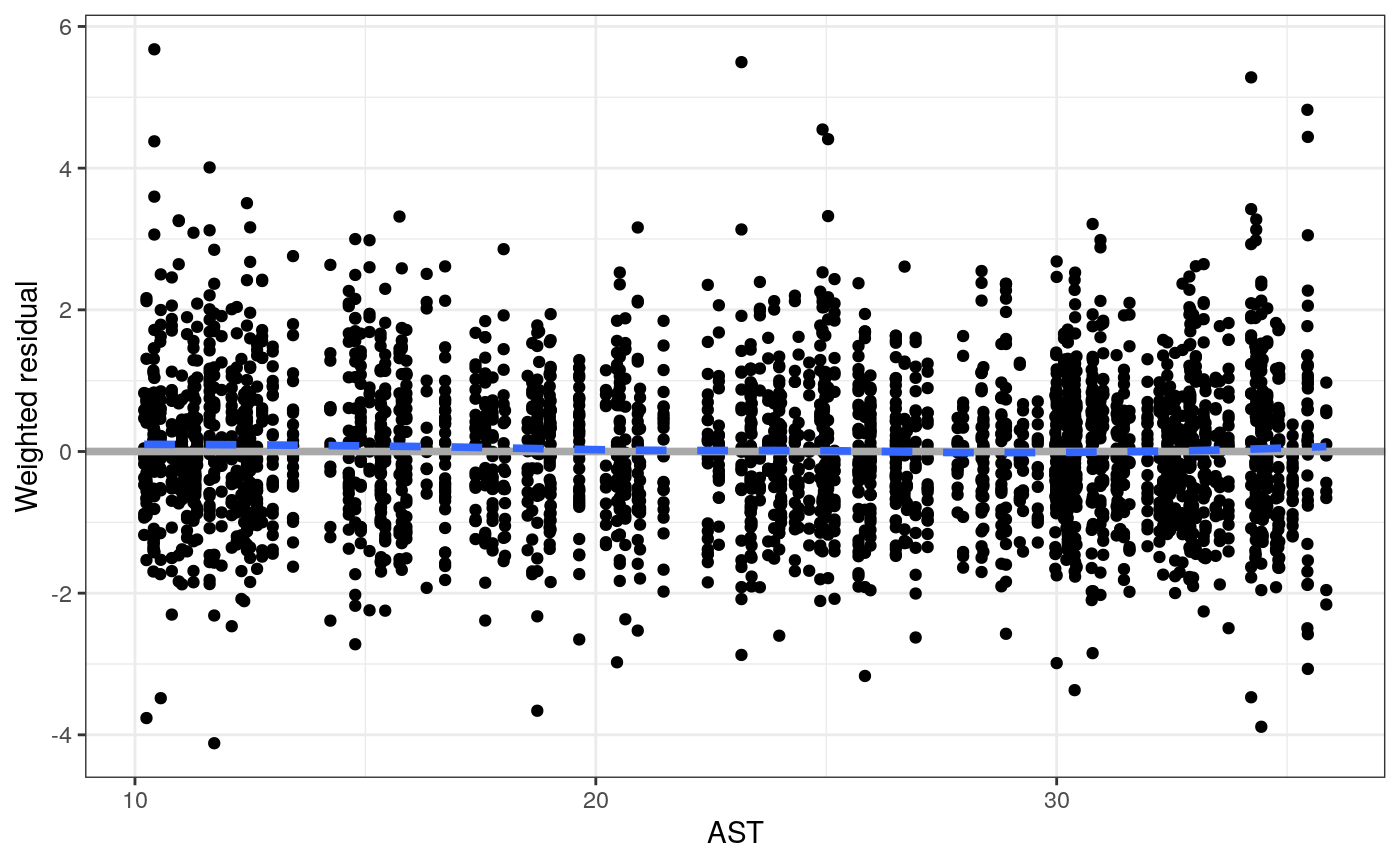
And we get a list of plots back. This list can be arranged on the fly with
covs <- c(
  "WT//Weight (kg)", "ALB//Albumin",
  "CRCL//Creatinine clearance", "AST//Aspartate aminotransferase"
)

wres_cont(data, x = covs) %>% pm_grid()
## Loading required namespace: cowplot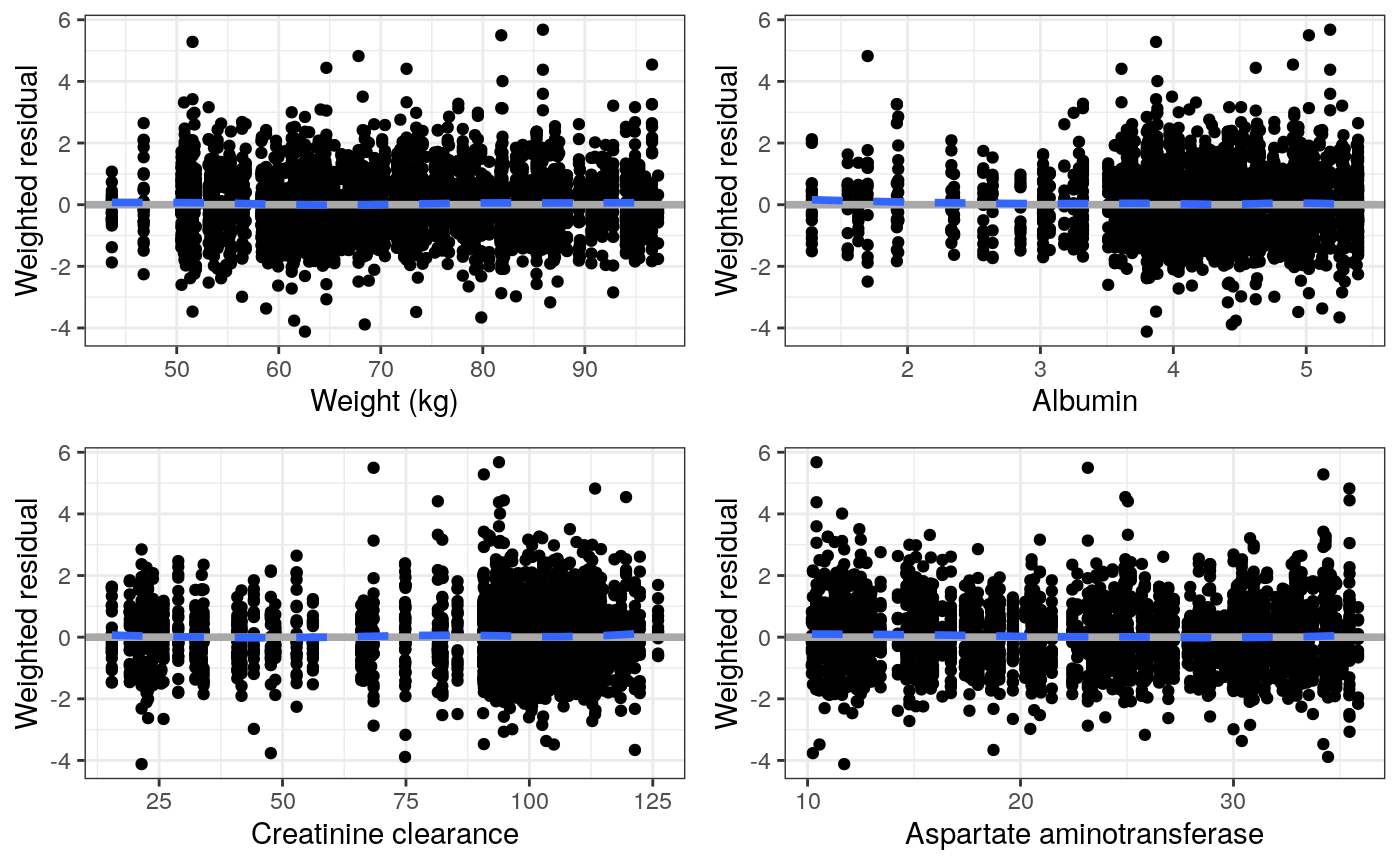
In this example, we also made the vector of inputs full col_label specification.
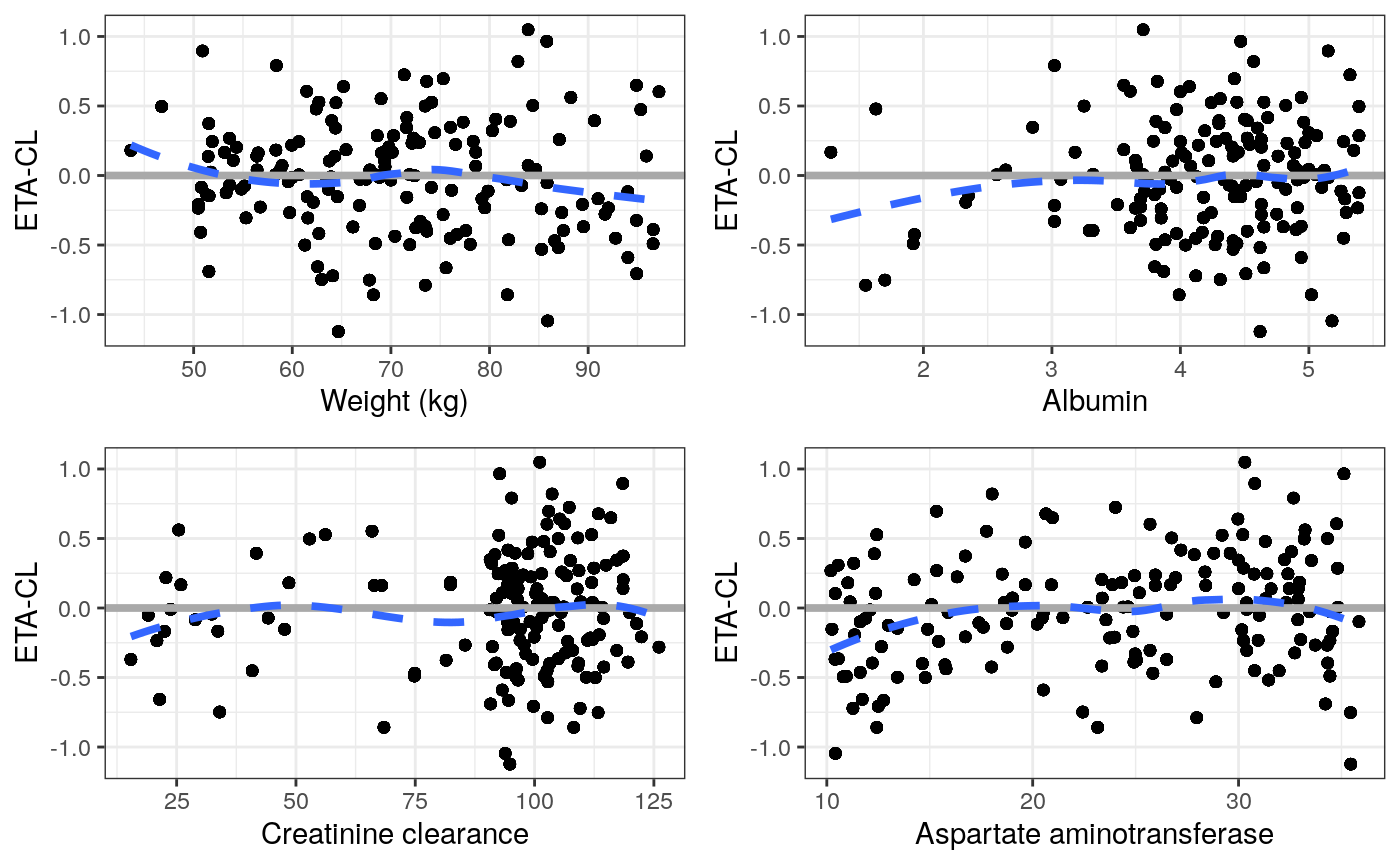
Another example are the eta_cont plots
What plots are vectorized?
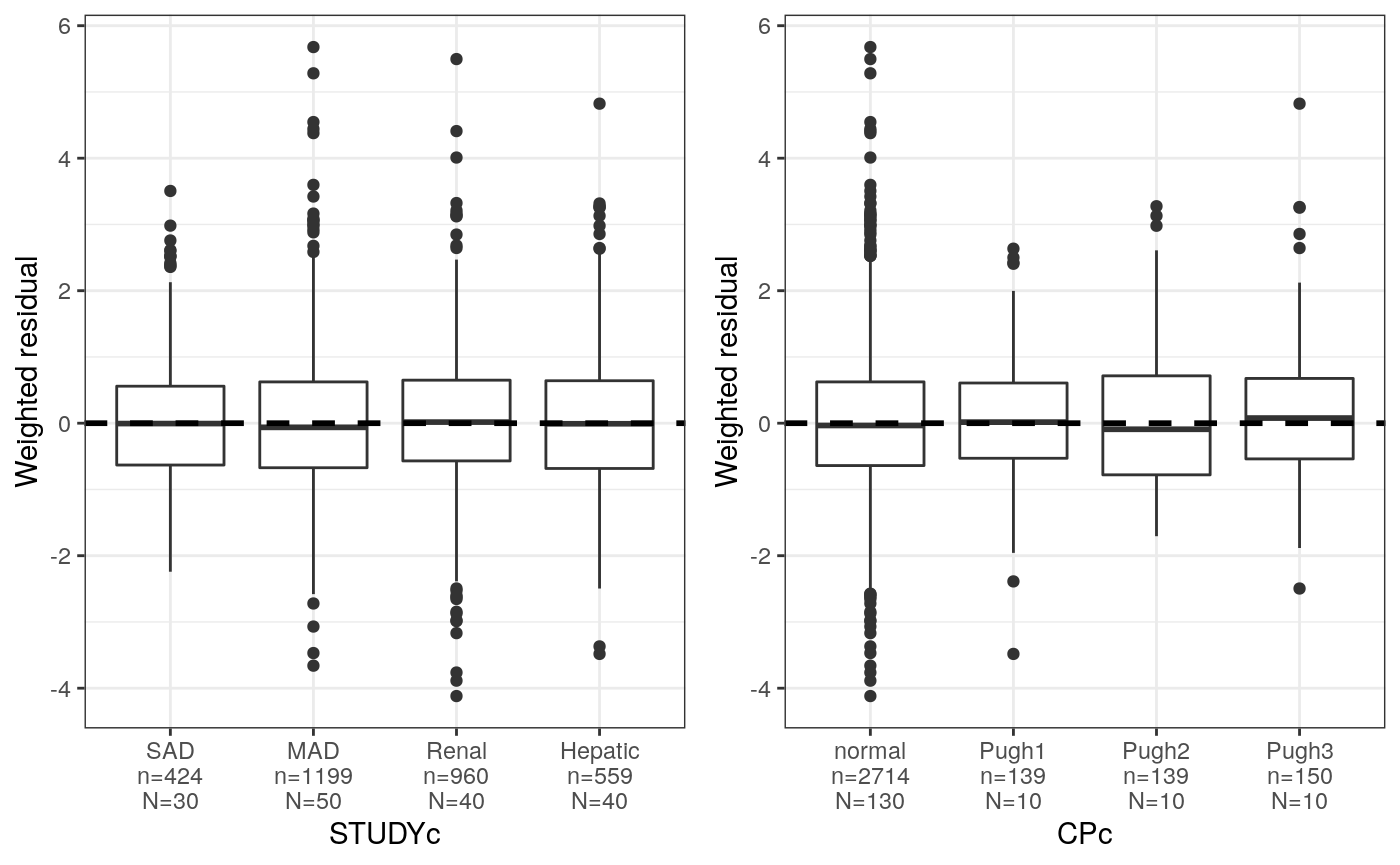
Basically any plot where the user is required to identify the column for plotting. So in the example, wres_cont asks the user to specify what the continuous variable is for the x-axis. This plot is vectorized. Same with wres_cat
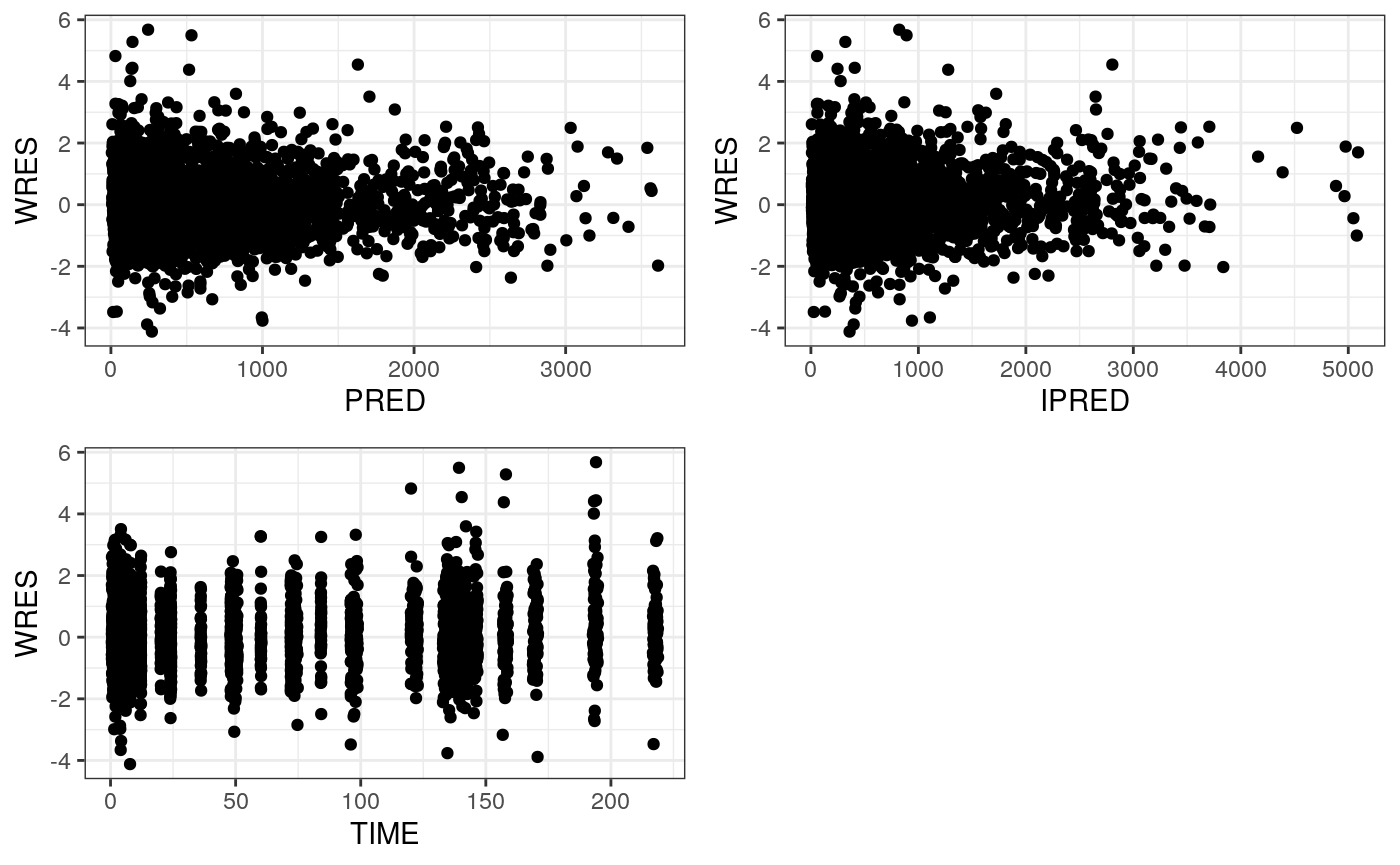
In contrast, dv_pred is hard-wired to look for DV and PRED. It is designed to look for only one thing on each axis. This plot is not vectorized.
You can use pm_scatter_list as a vectorized function to vectorize anyting. So this allows us to do
Or just use lapply or purrr::map
Please see the help topic for each function to know if that function is vectorized or not.