Pairs plots using ggpairs
pairs_plot.RdPairs plots using ggpairs
pairs_plot(x, etas, bins = 15, alpha = 0.6, fill = "black",
  col = "grey", upper_fun = NULL, lower_fun = NULL, ...)

eta_pairs(...)
Arguments
| x | plotting data.frame |
|---|---|
| etas | character col//label for pairs data; see |
| bins | passed to |
| alpha | passed to |
| fill | passed to |
| col | passed to |
| upper_fun | function to use for |
| lower_fun | function to use for |
| ... | passed to |
Value
The result from a ggpairs call (a single plot).
Details
This function requires the GGally package to be installed.
When the length of etas is one, arguments
are passed to eta_hist and that result is returned.
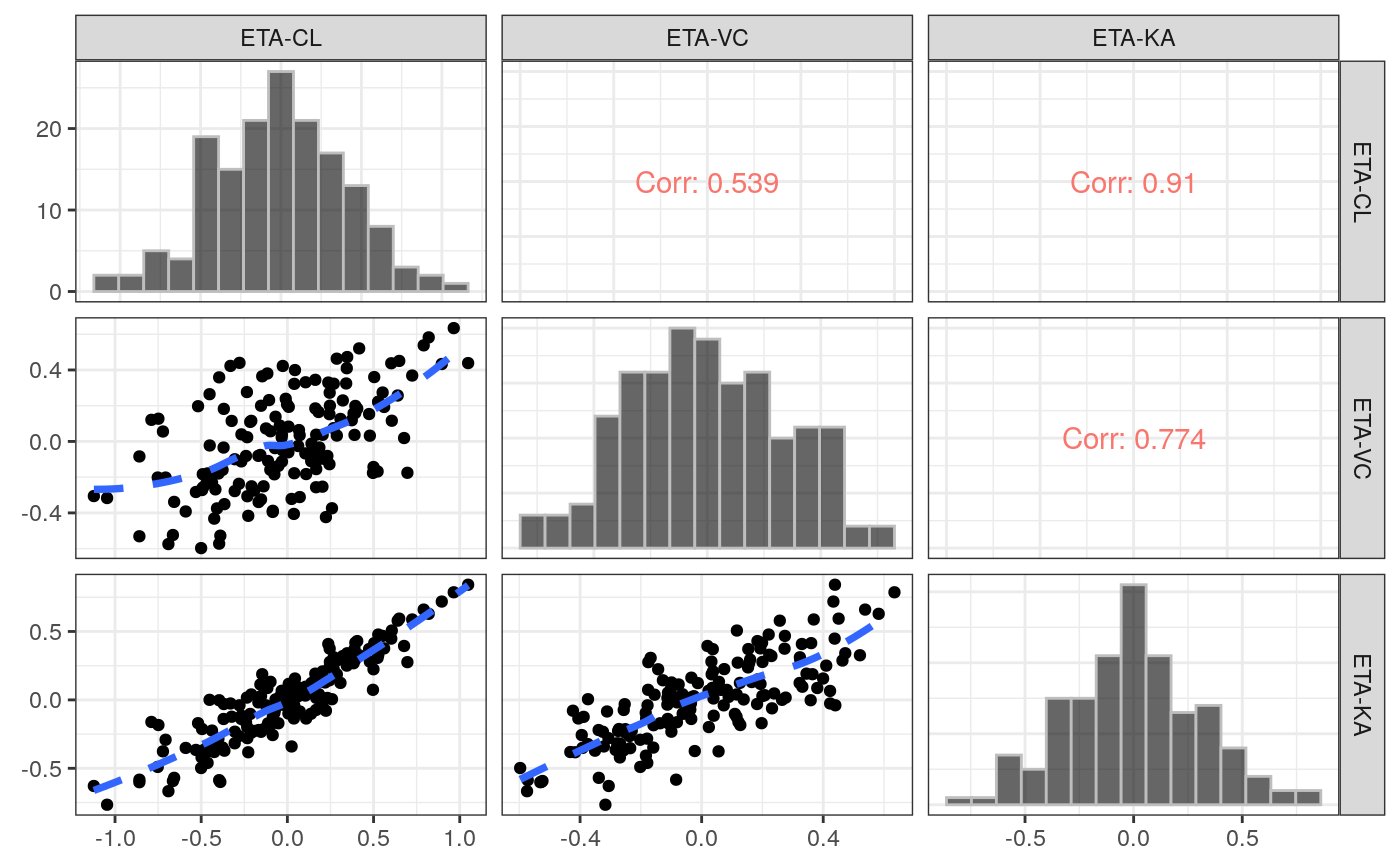
Examples
id <- pmplots_data_id() etas <- c("ETA1//ETA-CL", "ETA2//ETA-VC", "ETA3//ETA-KA") eta_pairs(id,etas)#>#> #> #>