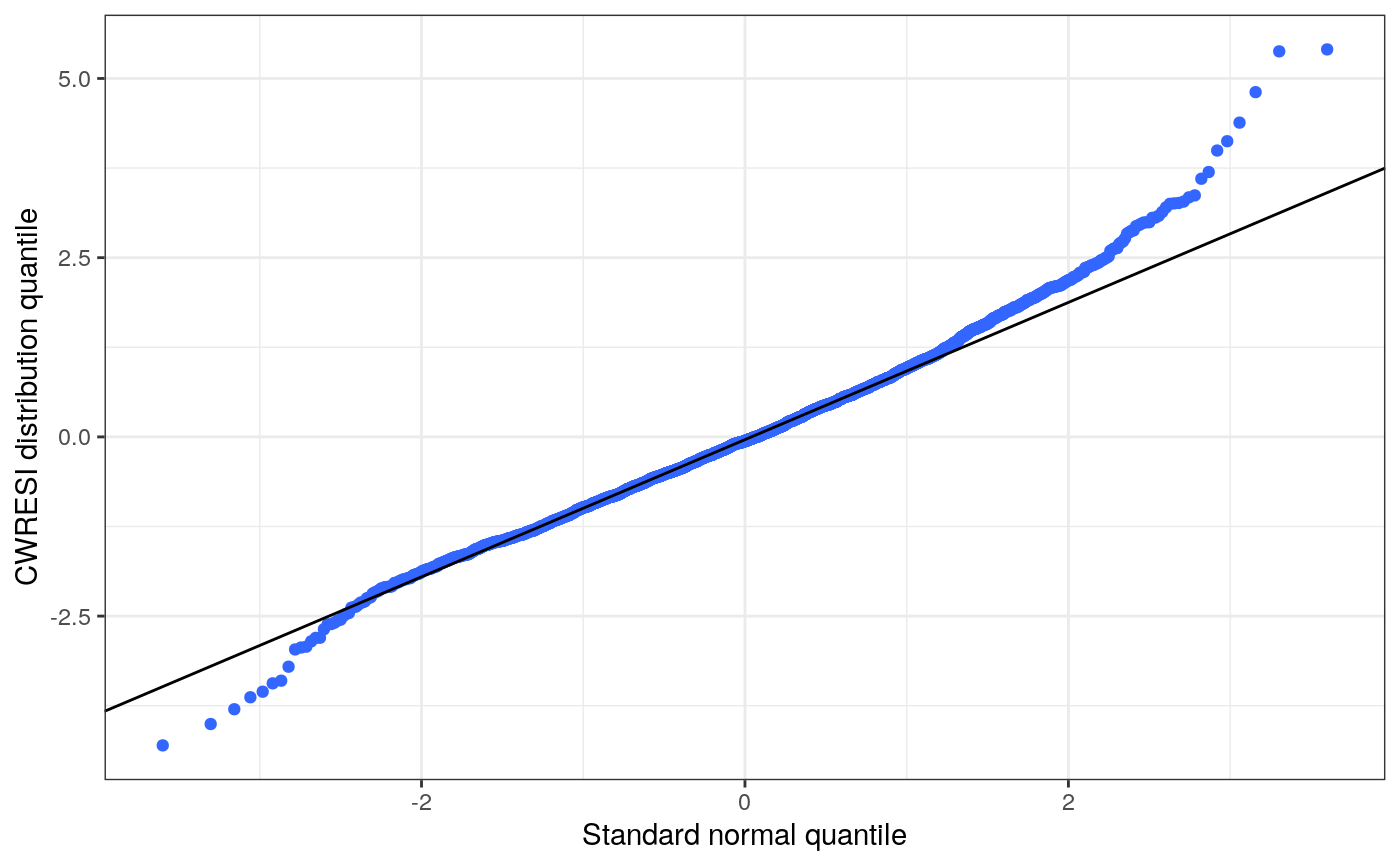
QQ plot for conditional residuals or NPDE
res_q.RdQQ plot for conditional residuals or NPDE
wres_q(df, x = "WRES", xs = defx(), ys = defy(), abline = NULL,
  ...)

cwres_q(df, x = "CWRES", ...)

cwresi_q(df, x = "CWRESI", ...)

npde_q(df, x = "NPDE", ...)
Arguments
| df | data frame to plot |
|---|---|
| x | character name for x-axis data |
| xs | see |
| ys | see |
| abline | numeric vector with two elements to be passed to
|
| ... | arguments passed back to |
Value
A single plot.
Details
The x column must be numeric.
Examples
#>