Wrapped / Faceted Plots
Kyle Baron
2021-09-13
Source:../../../data/GHE/deployment/deployments/2021-09-13/vignettes/wrapped_plots.Rmd
wrapped_plots.RmdExample data
There is are example data sets embedded in pmplots
data <- pmplots_data_obs()
id <- pmplots_data_id()
Rationale
For most applications, pmplots does not reshape your data frame; it works with what you pass in. However, for some applications, it is convenient to have a diagnostic plot that is faceted by a categorical variable in the data set. This vignette demonstrates the faceted plots that are available. This faceting support is for a focused set of plots only. Users should generally either create facets own or use the split_plot function for other applications.
Plots
wrap_res_time
Enter a vector of column names (or col_label) for the y argument
wrap_res_time(data, y = c("CWRESI", "WRES"))## `geom_smooth()` using formula 'y ~ x'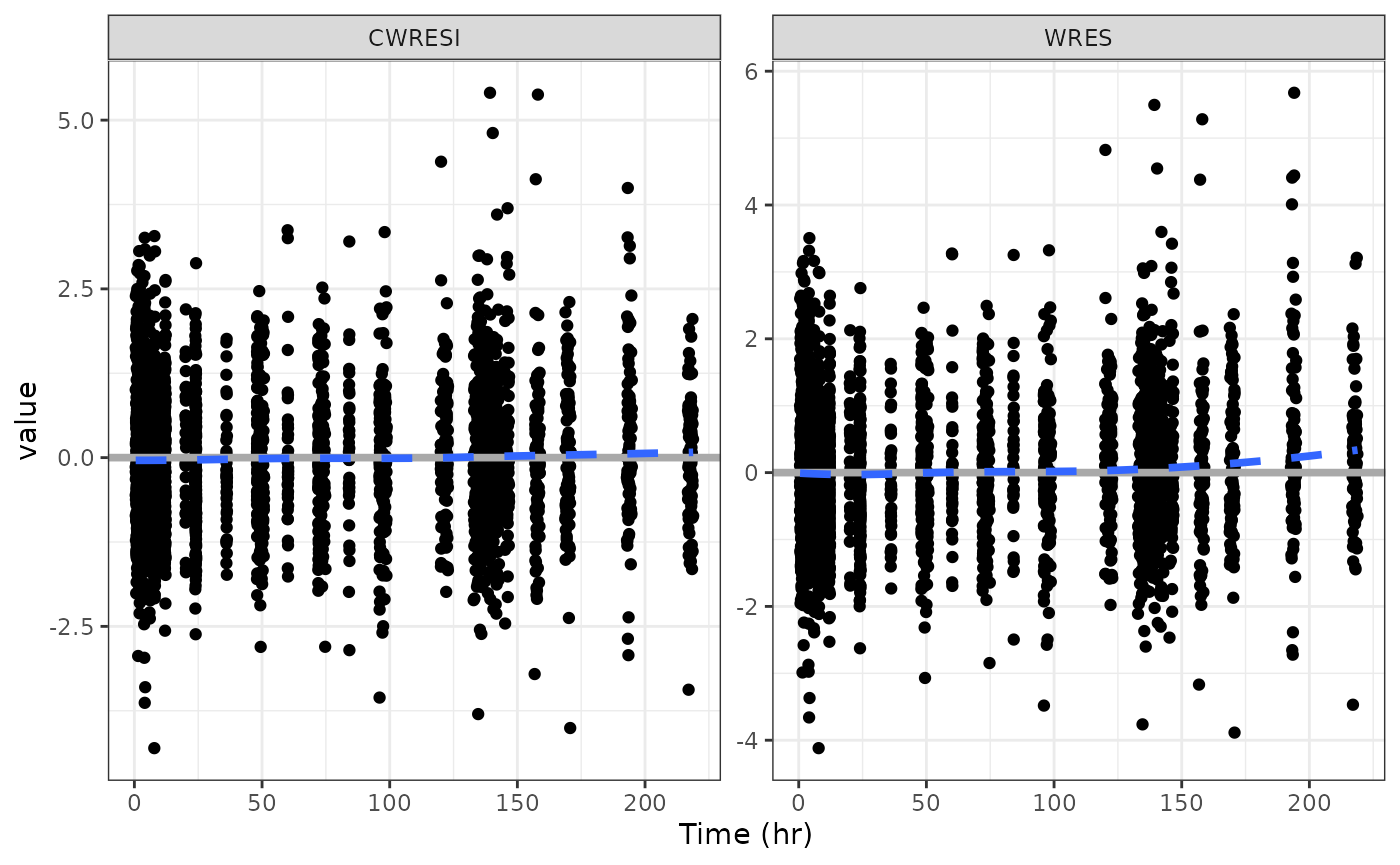
wrap_eta_cont
Here, enter a vector for the x argument
wrap_eta_cont(
  id,
  x = c("WT//WT (kg)", "BMI//BMI (kg/m2)", "ALB//ALB (g/dL)"),
  y = "ETA1//ETA-CL",
  scales="free_x",
  use_labels=TRUE
)
## `geom_smooth()` using formula 'y ~ x'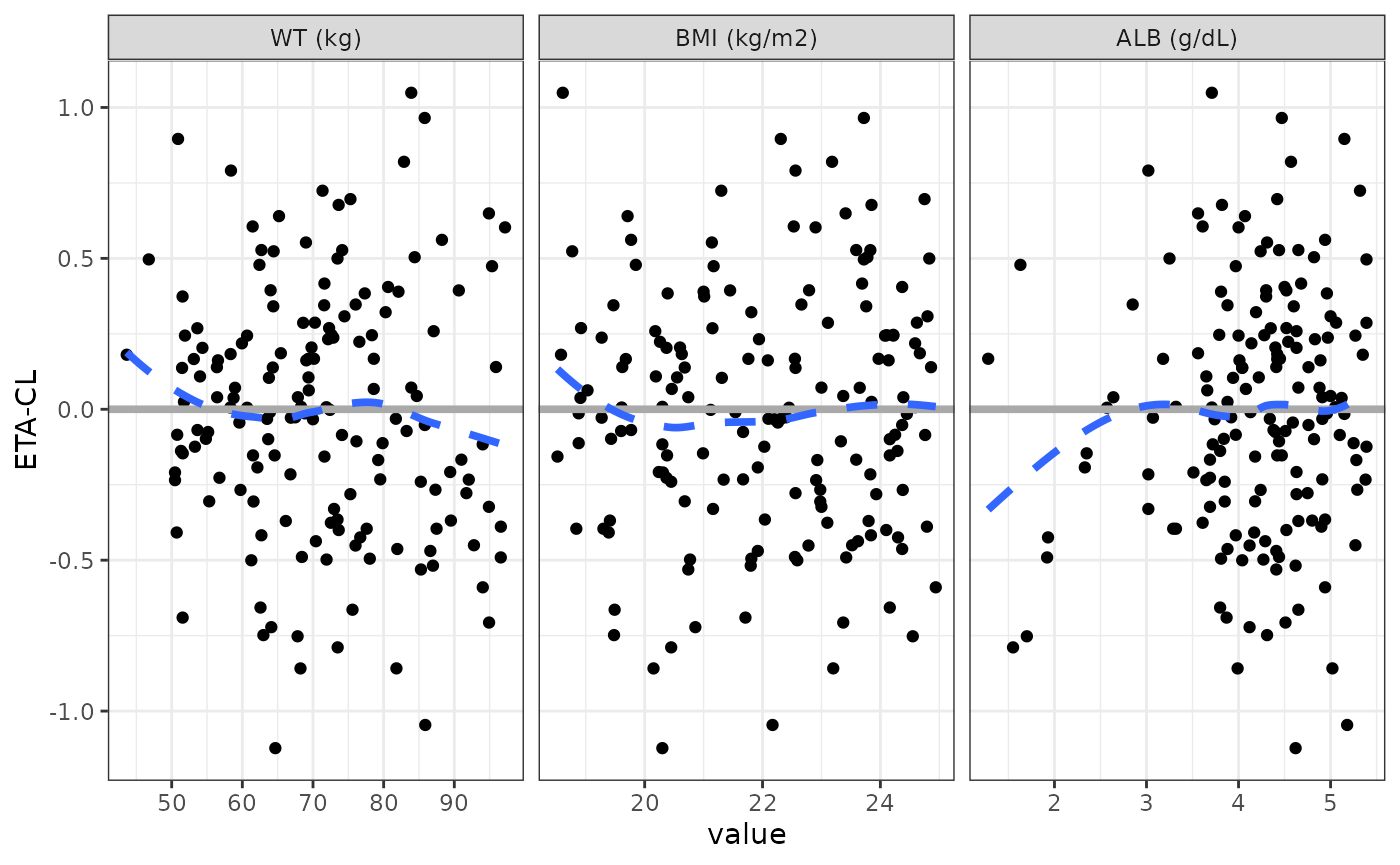
In this example, we enter labels along with column names and request that the labels be used for the shingle.
We can facet on x or y
wrap_eta_cont(
  id,
  x = "WT",
  y = c("ETA1", "ETA2", "ETA3"),
  scales="free_x"
)
## `geom_smooth()` using formula 'y ~ x'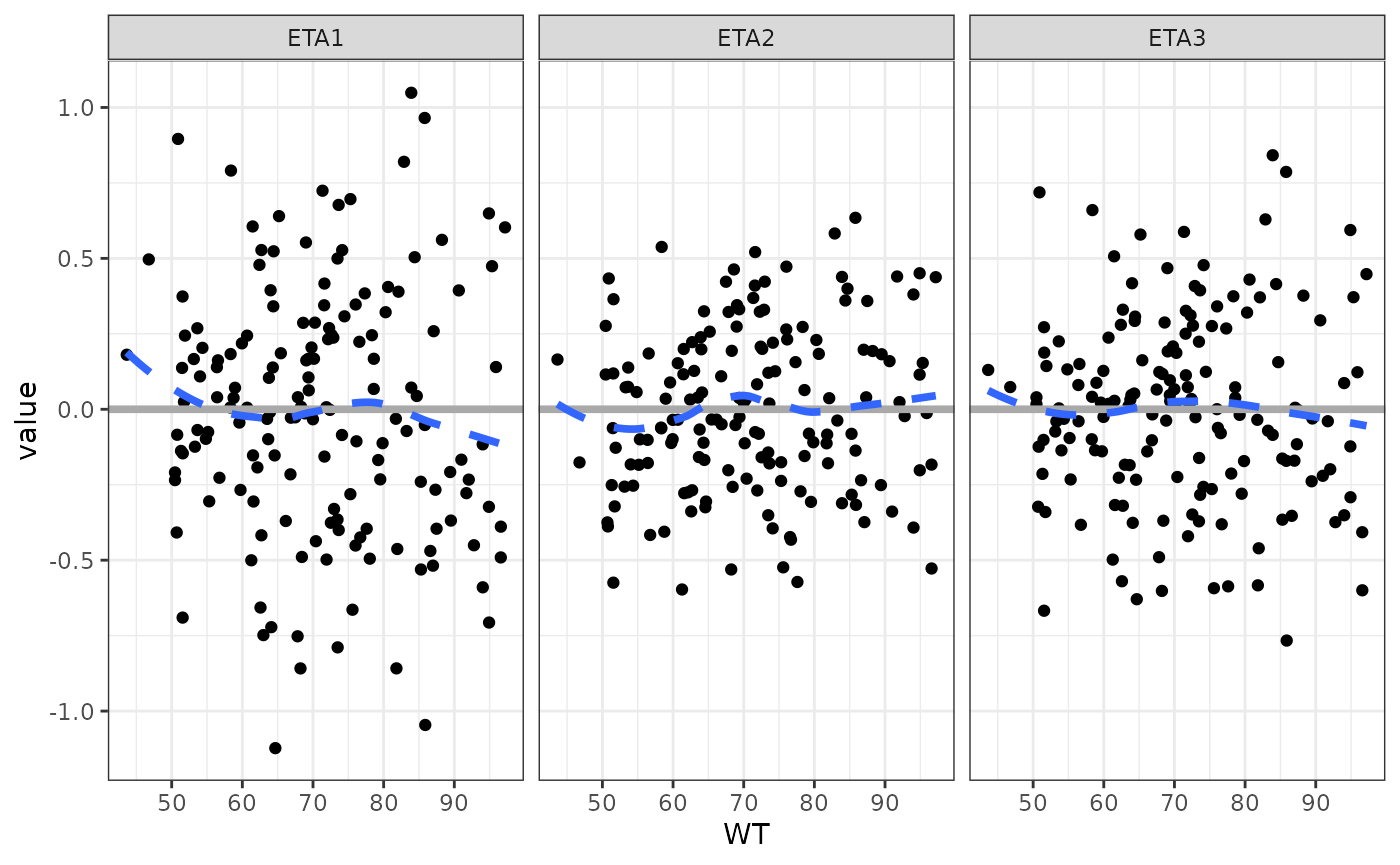
wrap_hist
Create a histogram with vector x column names
## `stat_bin()` using `bins = 30`. Pick better value with `binwidth`.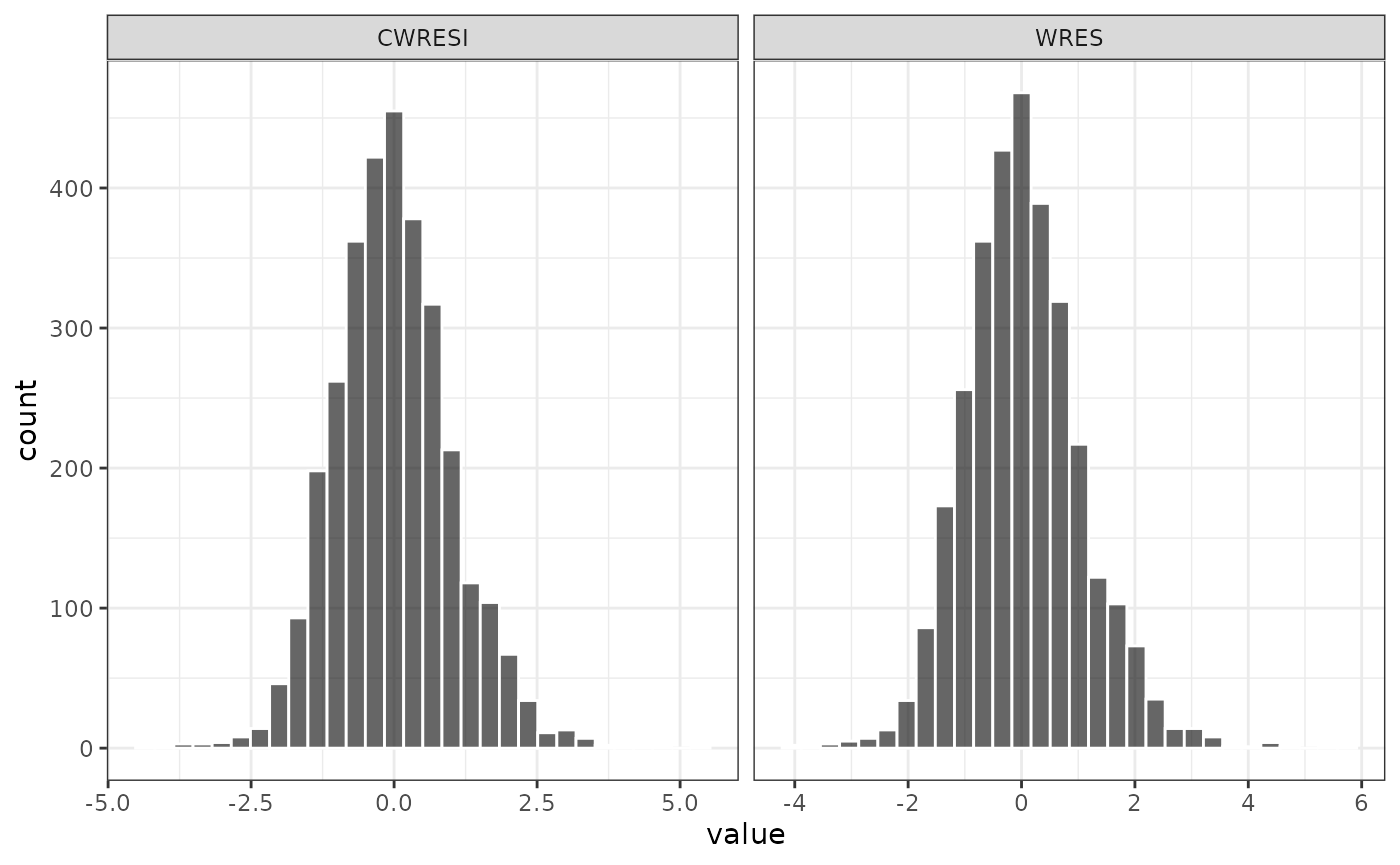
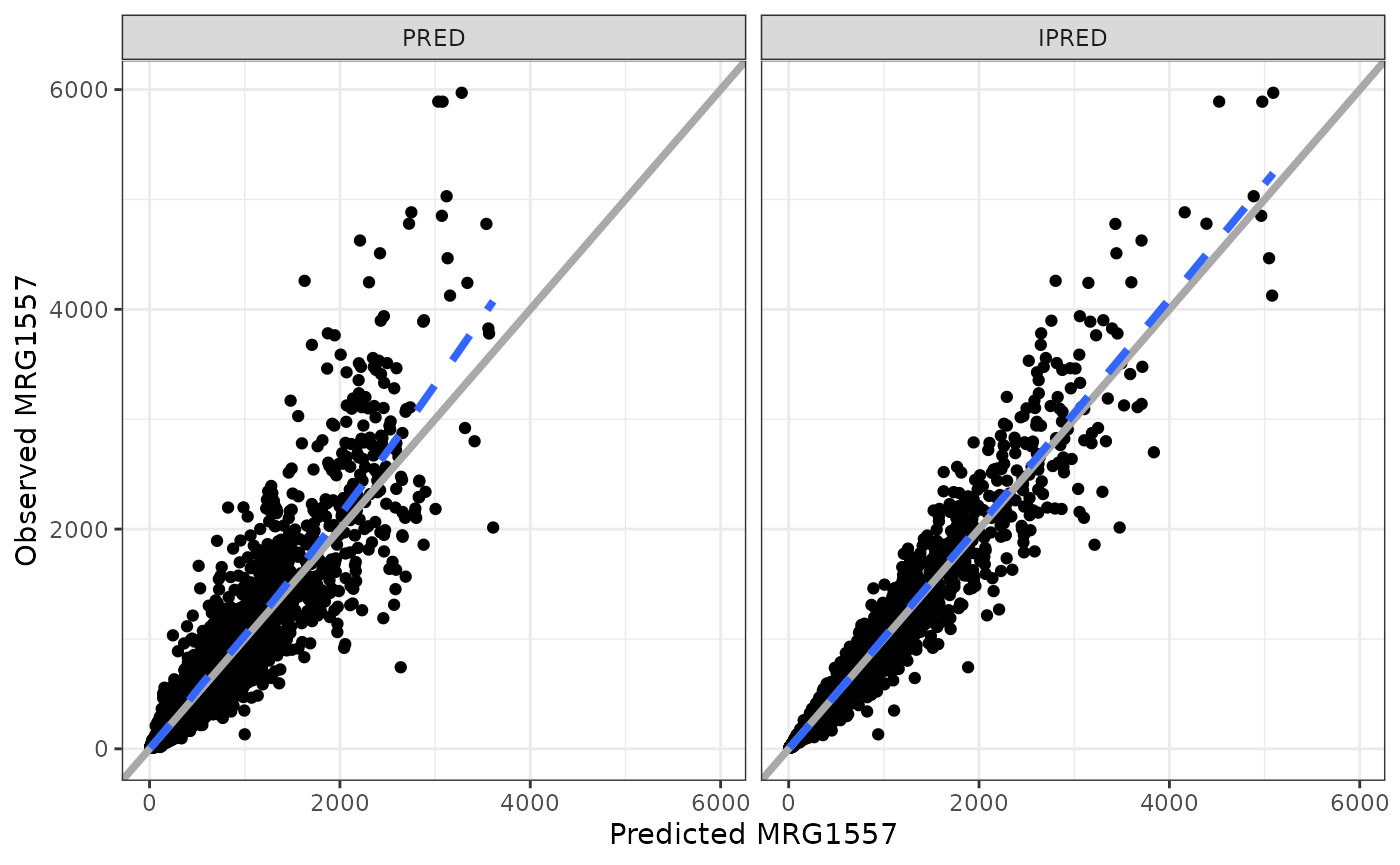
DV vs pred and DV vs ipred
wrap_dv_preds(data, yname = "MRG1557")## `geom_smooth()` using formula 'y ~ x'