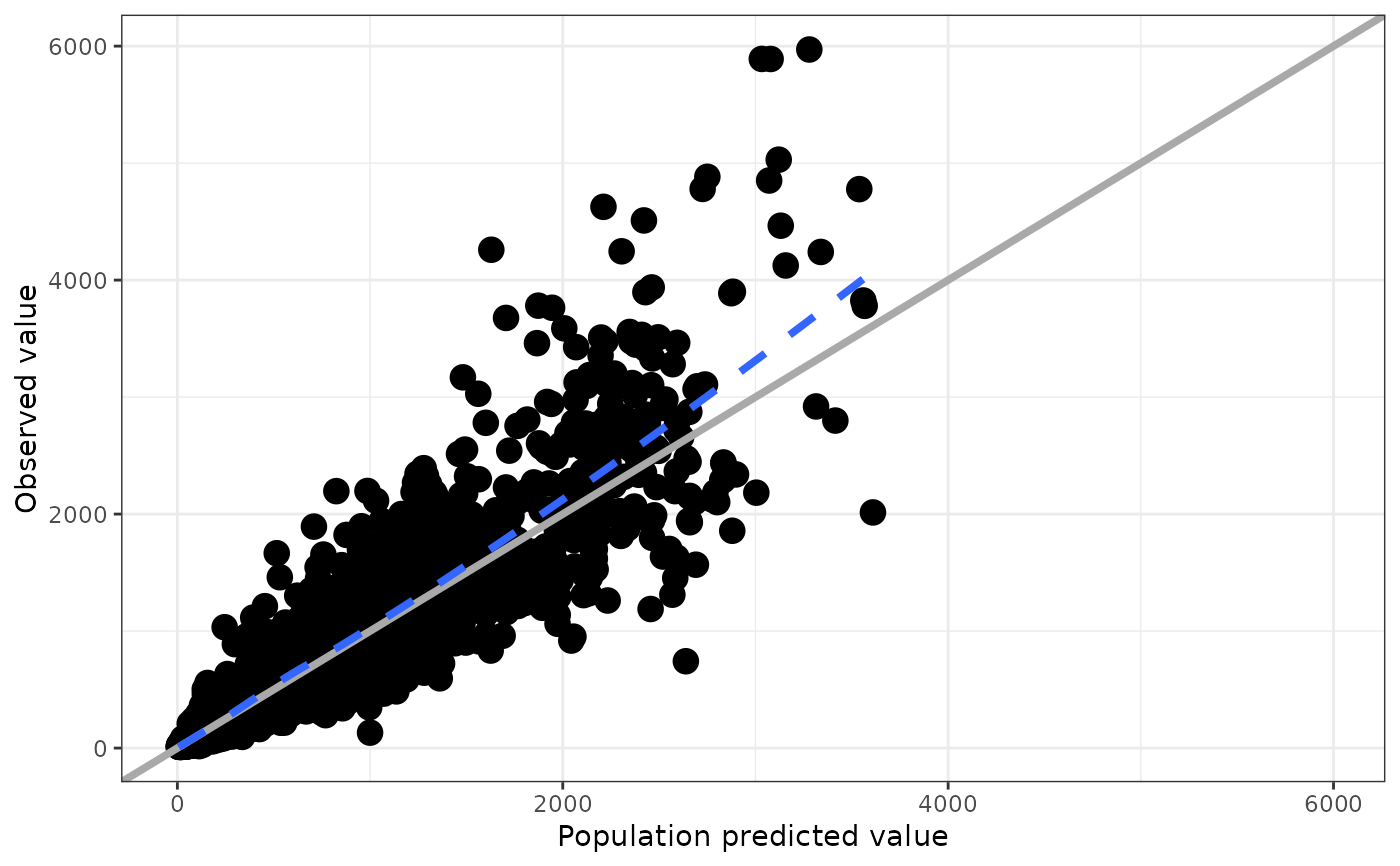
Plots for DV versus population or individual predicted values. dv_preds
makes both plots and returns them as a list (more in details).
dv_pred(
  df,
  x = pm_axis_pred(),
  y = pm_axis_dv(),
  yname = "value",
  xname = "value",
  ys = list(),
  xs = ys,
  loglog = FALSE,
  scales = c("fixed", "free", "null"),
  logbr = c("full", "half", "null"),
  ...
)

dv_ipred(df, x = pm_axis_ipred(), ...)

dv_preds(df, ...)
Arguments
| df | data frame to plot |
|---|---|
| x | character name for x-axis data |
| y | character name for y-axis data |
| yname | used to form y-axis label |
| xname | used to form x-axis label |
| ys | see |
| xs | see |
| loglog | if |
| scales | if |
| logbr | when using log scale, should the tick marks be at |
| ... | passed to |
Value
dv_pred and dv_ipred return a single plot; dv_preds returns a list
of plots.
Details
Since this function creates a scatter plot, both the x and y columns
must be numeric.
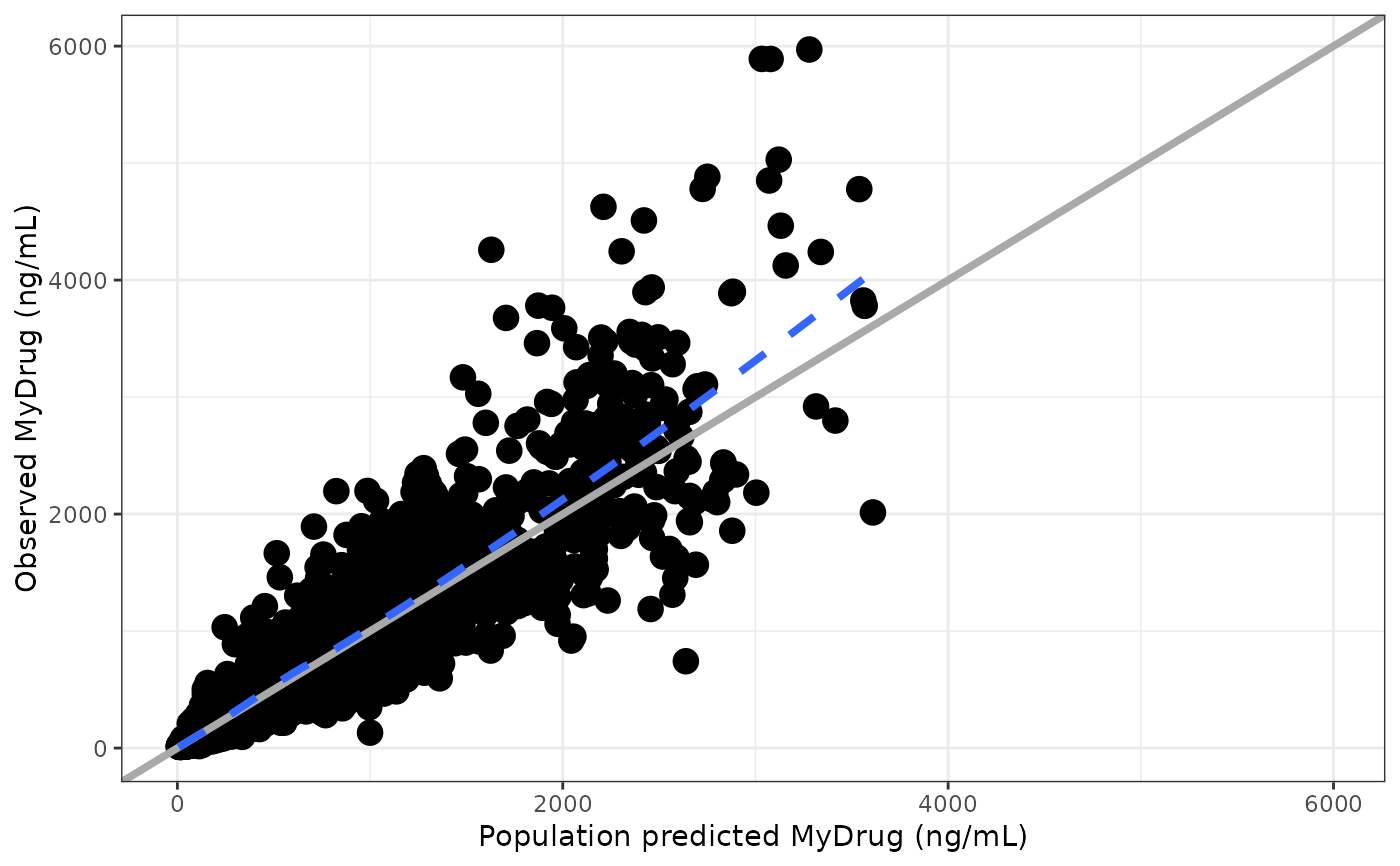
dv_preds returns a list of two plots, with the result of dv_pred in the
first position and the result of dv_ipred in the second position. In
this case, ... are passed to both functions.
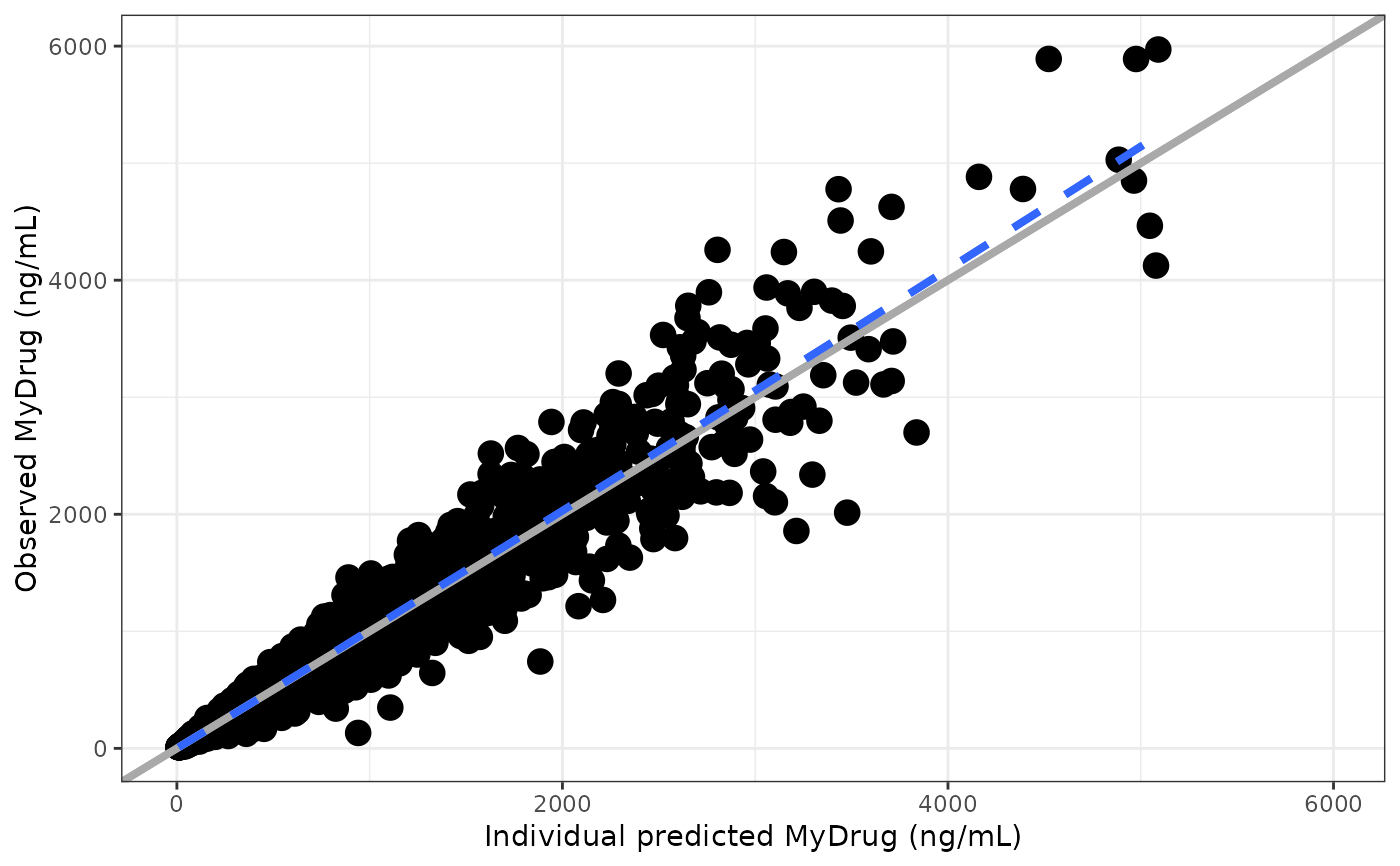
Examples
#>dv_ipred(df, yname="MyDrug (ng/mL)")#>#>dv_preds(df, yname = "MyDrug (ng/mL)")#> [[1]]#>#> #> [[2]]#>#>#>