This function is a wrapper to GGally::ggpairs() with customized
functions for upper and lower off-diagonal panels. See details for help
on customizing some aspects of the off-diagonal plots.
pairs_plot(
  x,
  y,
  bins = 15,
  alpha = opts$histogram.alpha,
  fill = opts$histogram.fill,
  col = opts$histogram.col,
  label_fun = label_parse_label,
  lower_plot = pairs_lower_plot,
  upper_fun = NULL,
  lower_fun = NULL,
  diag = c("barDiag", "densityDiag", "blankDiag"),
  ...
)

eta_pairs(x, etas, ...)
Arguments
| x | plotting data.frame |
|---|---|
| y | character |
| bins | passed to |
| alpha | passed to |
| fill | passed to |
| col | passed to |
| label_fun | labeller function that gets passed to |
| lower_plot | function to create plots in the lower triangle; the
should accept a single argument (a |
| upper_fun | function to use for |
| lower_fun | function to use for |
| diag | how to render data on the diagonal; options are limited to those
accepted by |
| ... | passed to |
| etas | character |
Value
The result from a ggpairs call (a single plot).
Details
This function requires the GGally package to be installed.
When the length of etas is one, arguments are passed to eta_hist() and
that result is returned.
Use the options object to modify aspects of the smoother line:
smooth.col, smooth.lwd, smooth.lty, smooth.method. Also, use the
options object to control aspects of the points: scatter.col,
scatter.size.
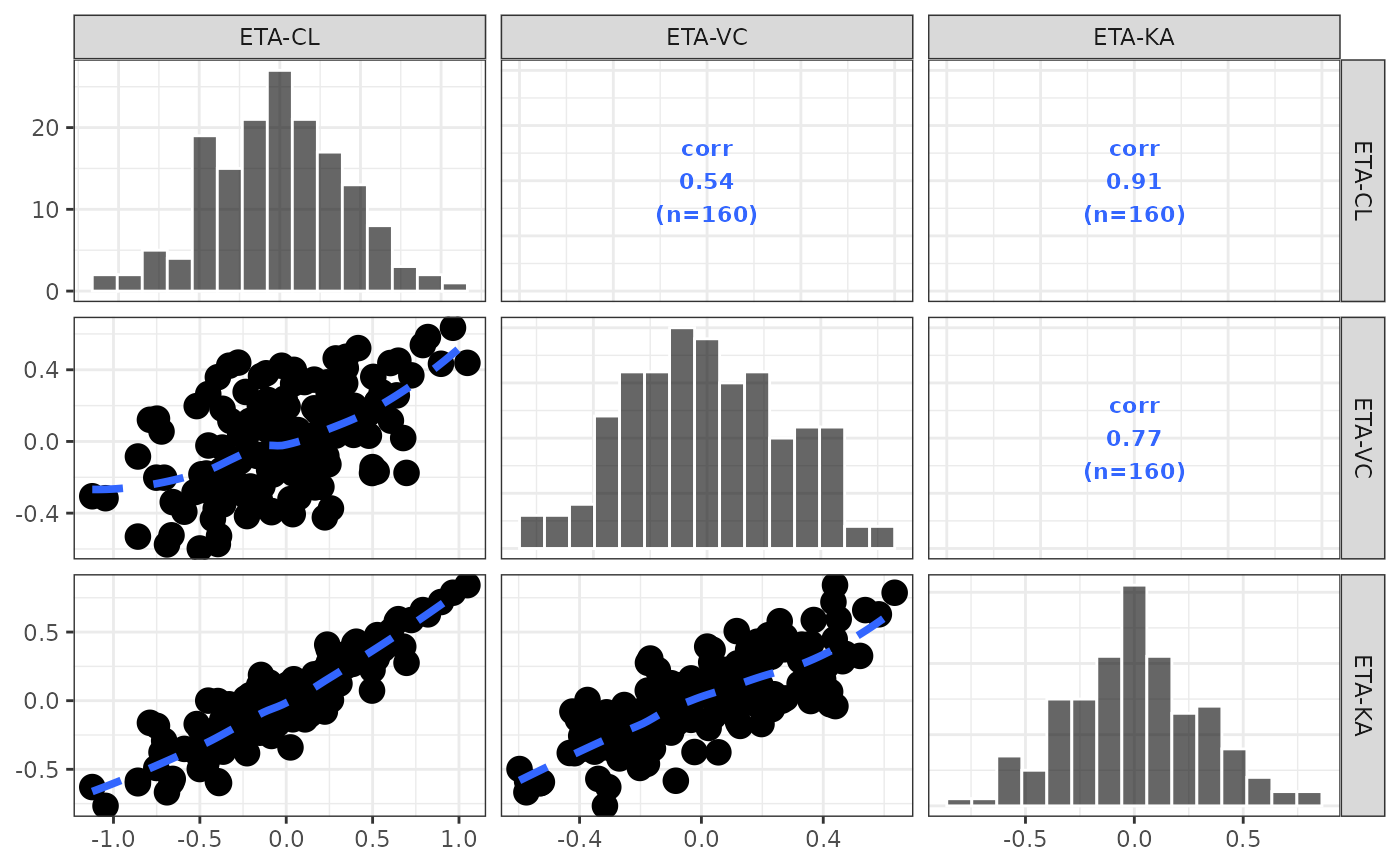
Examples
id <- pmplots_data_id() etas <- c("ETA1//ETA-CL", "ETA2//ETA-VC", "ETA3//ETA-KA") eta_pairs(id,etas)#>#> #> #>#>#>#>#>#>#>